Docs / Guide
Set up your workspace
Build an order-flow workspace — tabs, multi-chart layouts, panes, indicators, drawings and saved templates — and find the same setup tomorrow.
Updated
Open the terminal
New to this? Read what order flow is first — it explains what the chart below is showing.
The chart loads without an account. Everything below works as a guest — an account only makes it persist. Choose an instrument and timeframe from the toolbar, then switch between Candles and Footprint when you want either the summary of price or the trades inside each bar.
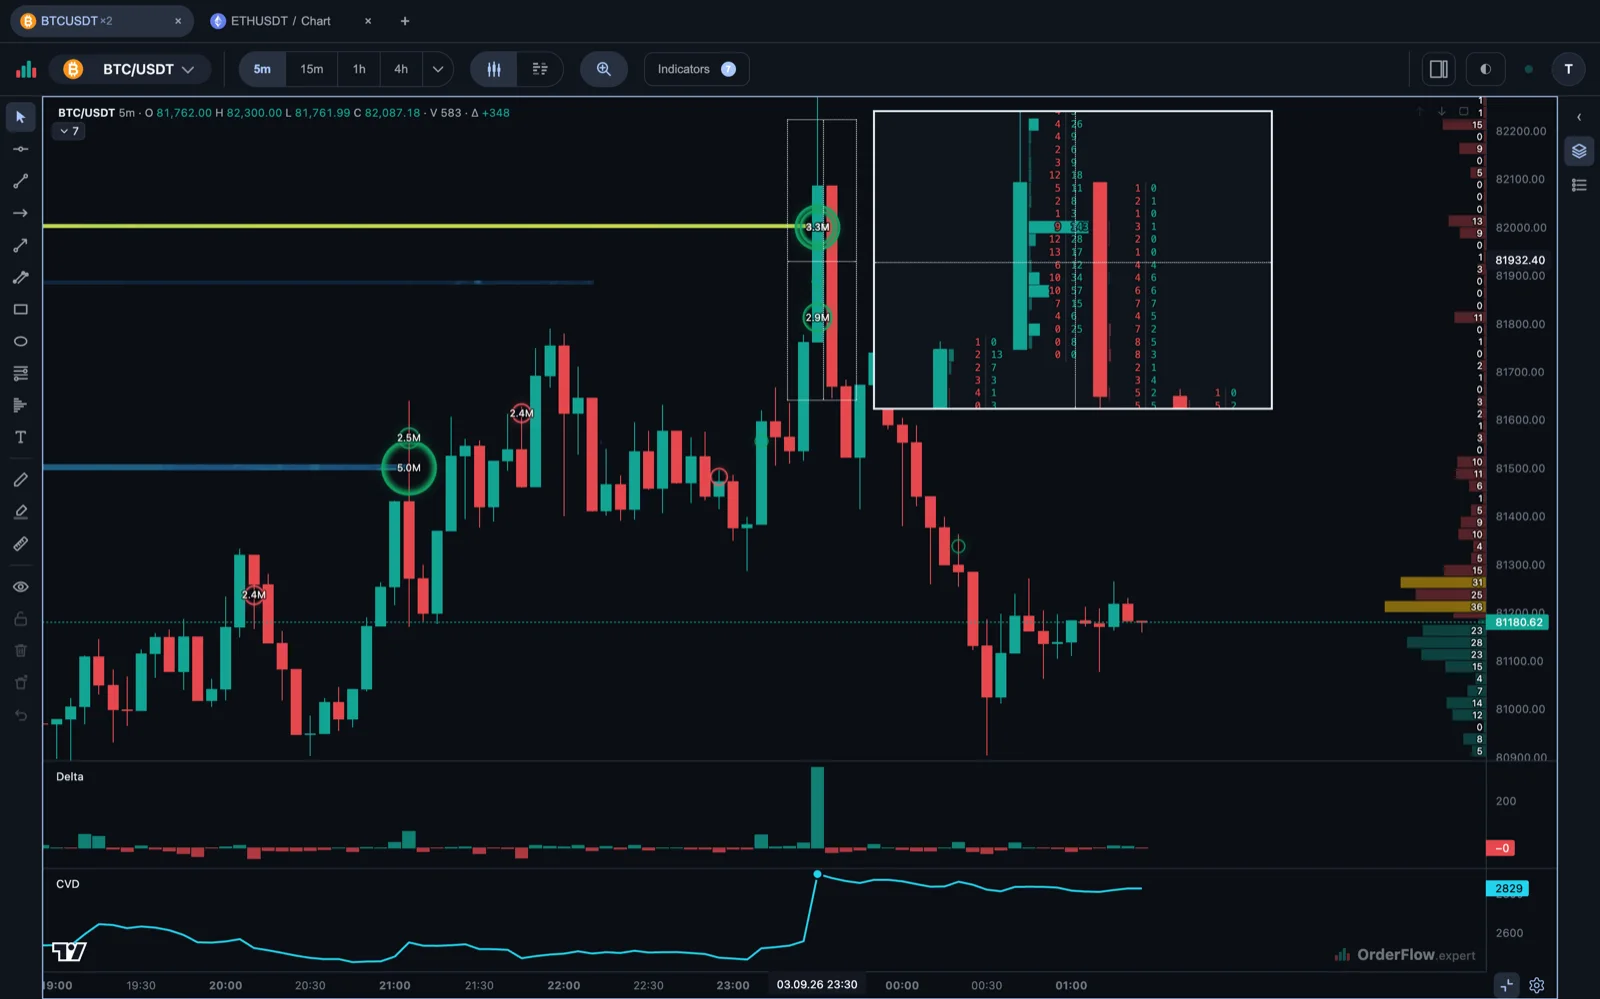
Tabs
Each tab owns its own chart, layout, panes, indicators and drawings. Use tabs to keep separate ideas apart: one can hold a fast execution view while another keeps the higher-timeframe context. Signed-in workspaces save those choices, so you can return to the same setup later.
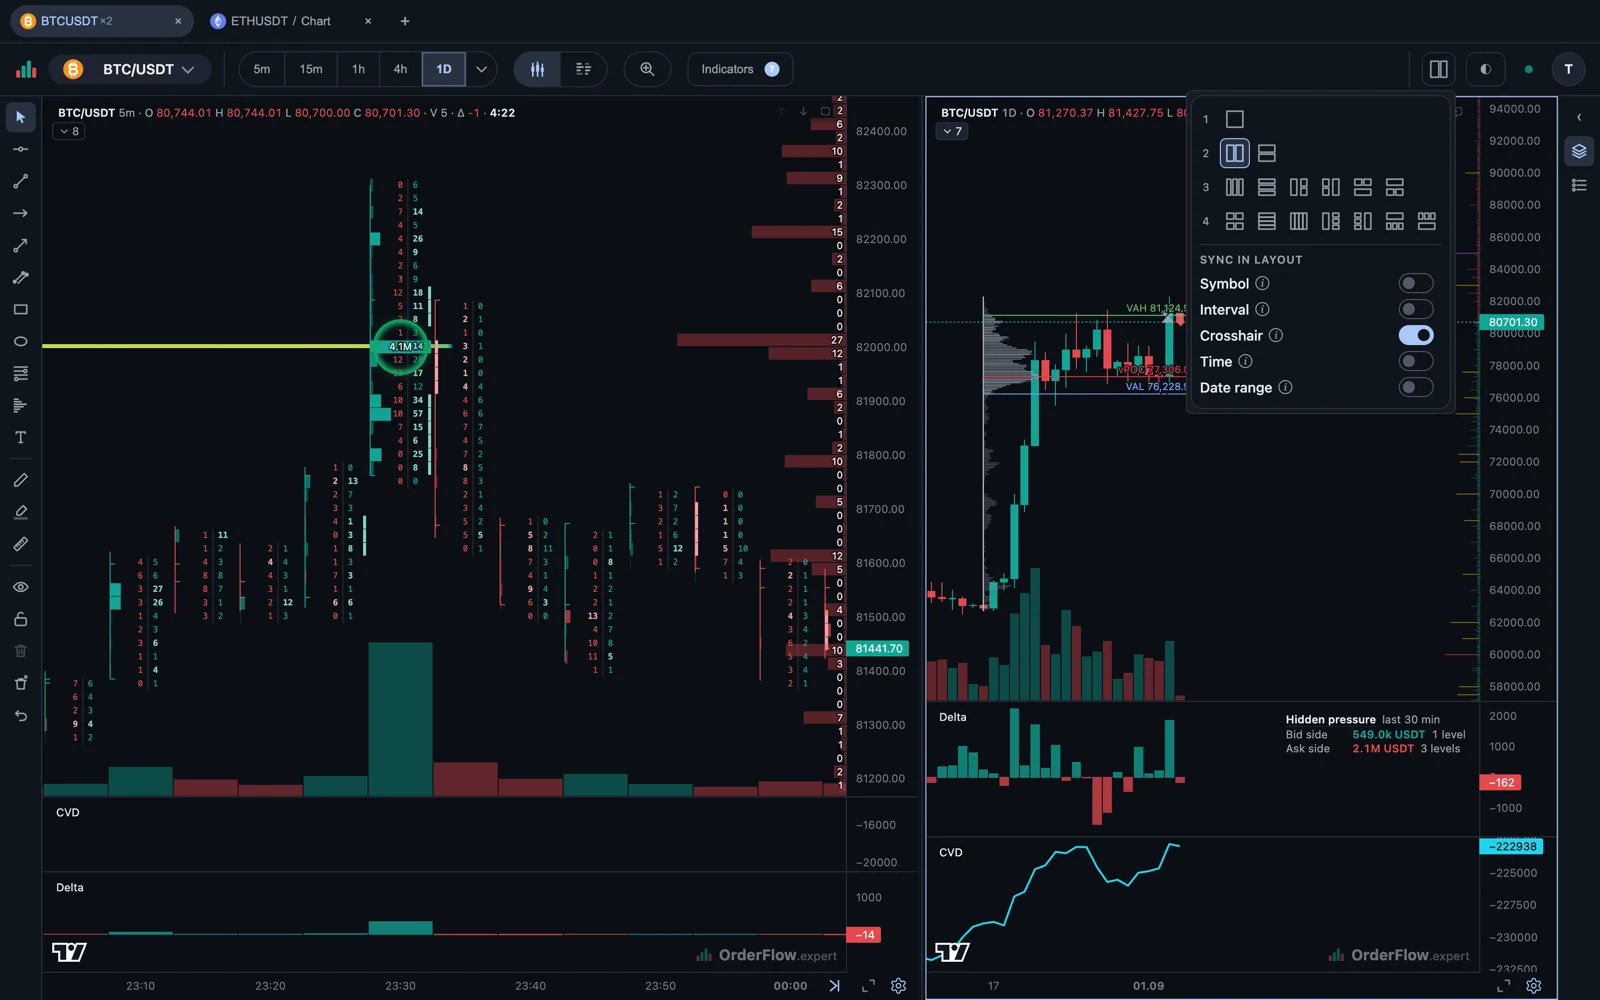
A tab is not limited to one chart. Split it into two, three or four, and each area keeps its own instrument, timeframe, indicators and drawings — switches decide whether they share the symbol, the interval, the crosshair, the time or the date range.
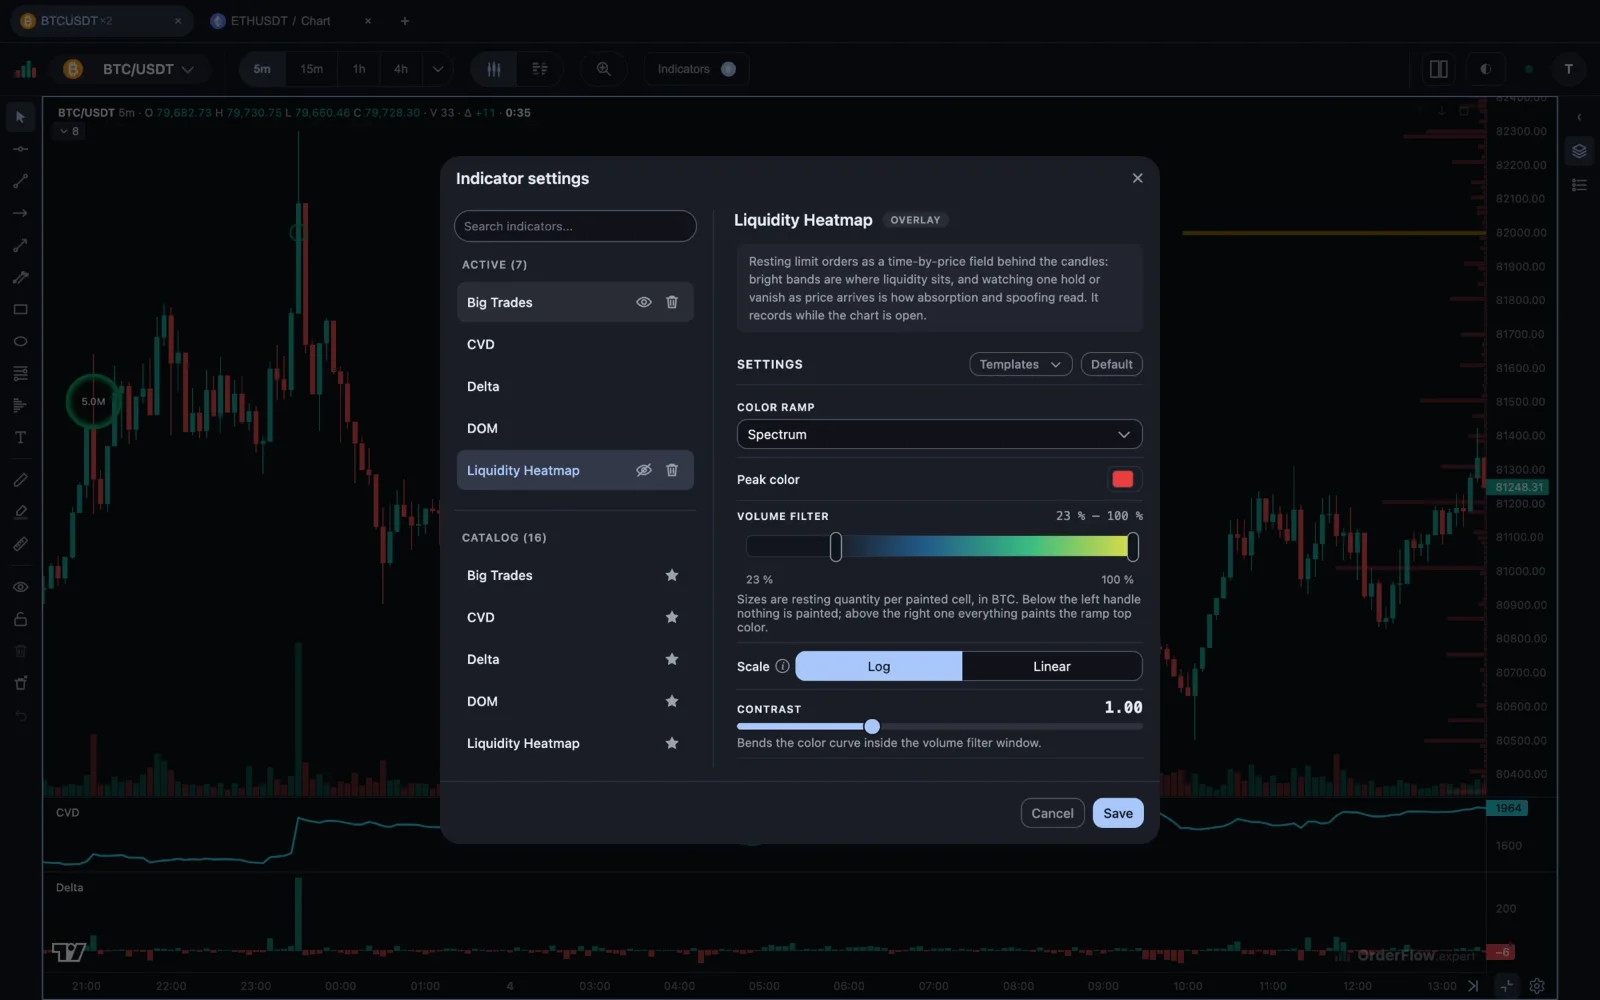
Panes and indicators
Add an indicator from the chart controls, then decide whether it belongs over price or in its own pane. Main-pane studies, such as Anchored VWAP, Bollinger Bands or Market Sessions, share the price view. Oscillators and CVD can use dedicated panes. The pane legend identifies the studies currently visible and gives you a quick way to manage them.
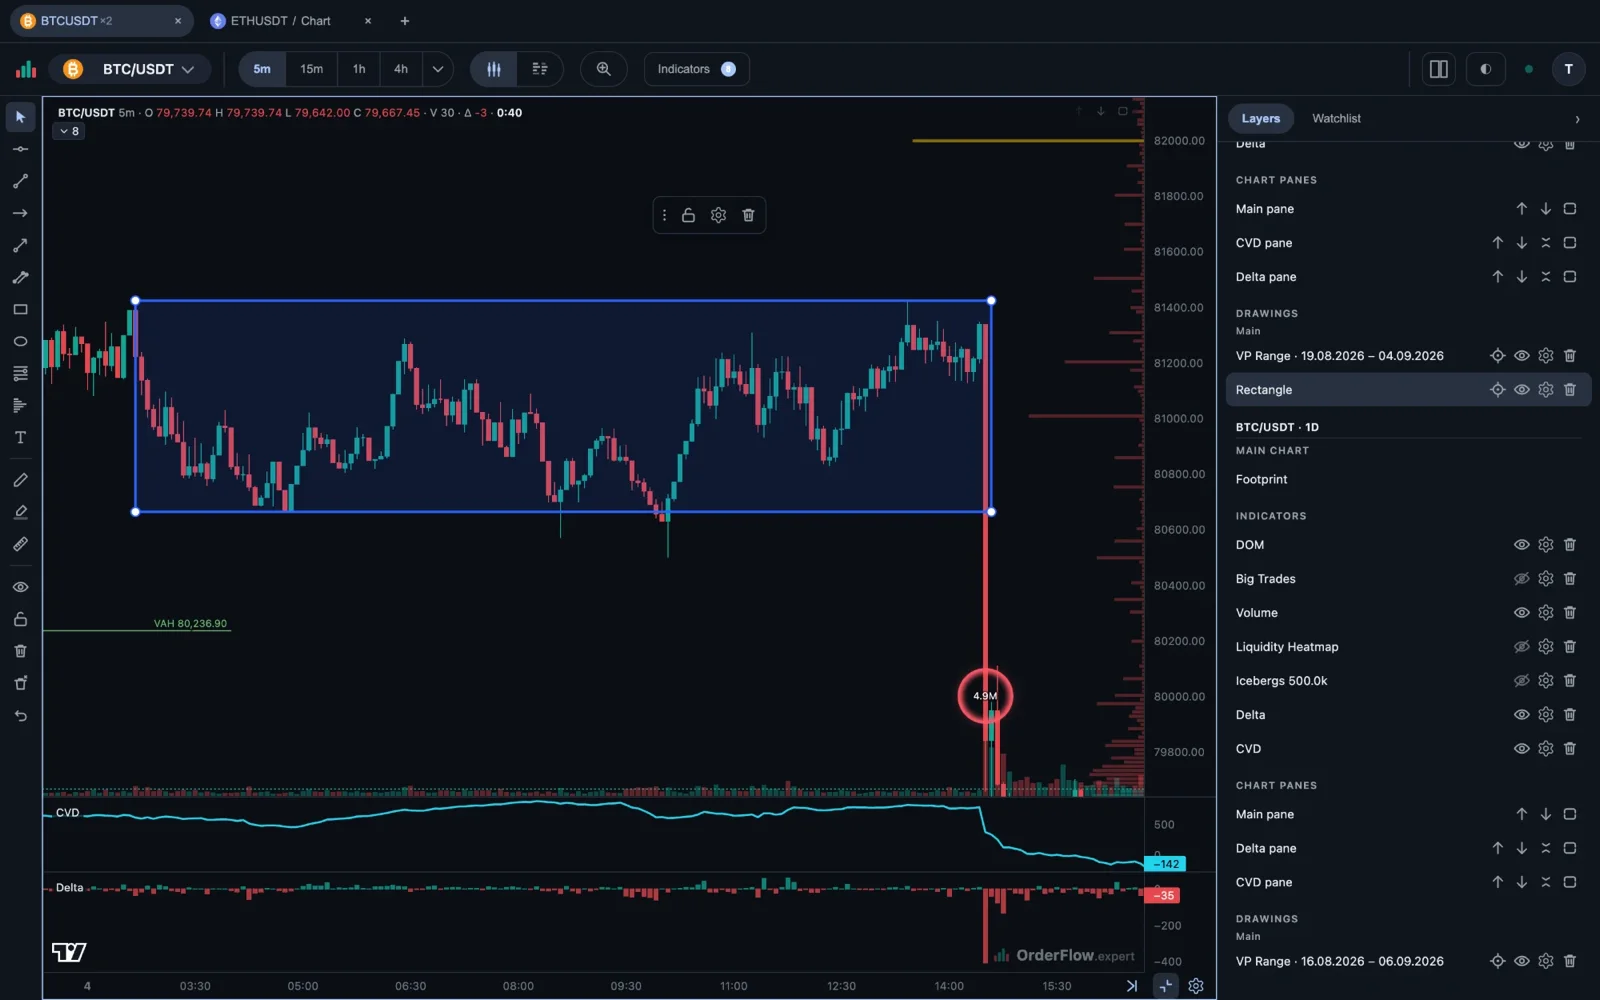
Drawings
The drawing toolbar includes lines, channels, Fibonacci tools, measure, pen, highlighter, oval and the Volume Profile range — the last one is a drawing you place over a stretch of chart, not an indicator you add to a pane. Select a drawing to adjust it with the selection toolbar. The Layers panel keeps every drawing in the active tab visible, so you can find, hide or remove an object without hunting for it on the chart.
Templates
Templates save the settings of an indicator or drawing style under a name you choose. Use them for repeatable views: for example, one footprint colour scheme for a short timeframe and another for a higher-timeframe chart. A template saves configuration, not market data or a copy of the chart.
Keeping it
Create an account when you want the workspace to follow you beyond this browser. Your guest tabs, layouts, indicators and drawings transfer into the new account. An account also lets the terminal remember later changes; it is not required to open a chart or start learning order flow.