Docs / Guide
Volume Profile
Volume Profile over any range you draw: the point of control (POC), the value area (VAH and VAL), the shape letter (D, P, b, B), and why the rows come from stored trades rather than from a candle spread across its range.
Updated
Volume by price, not by time
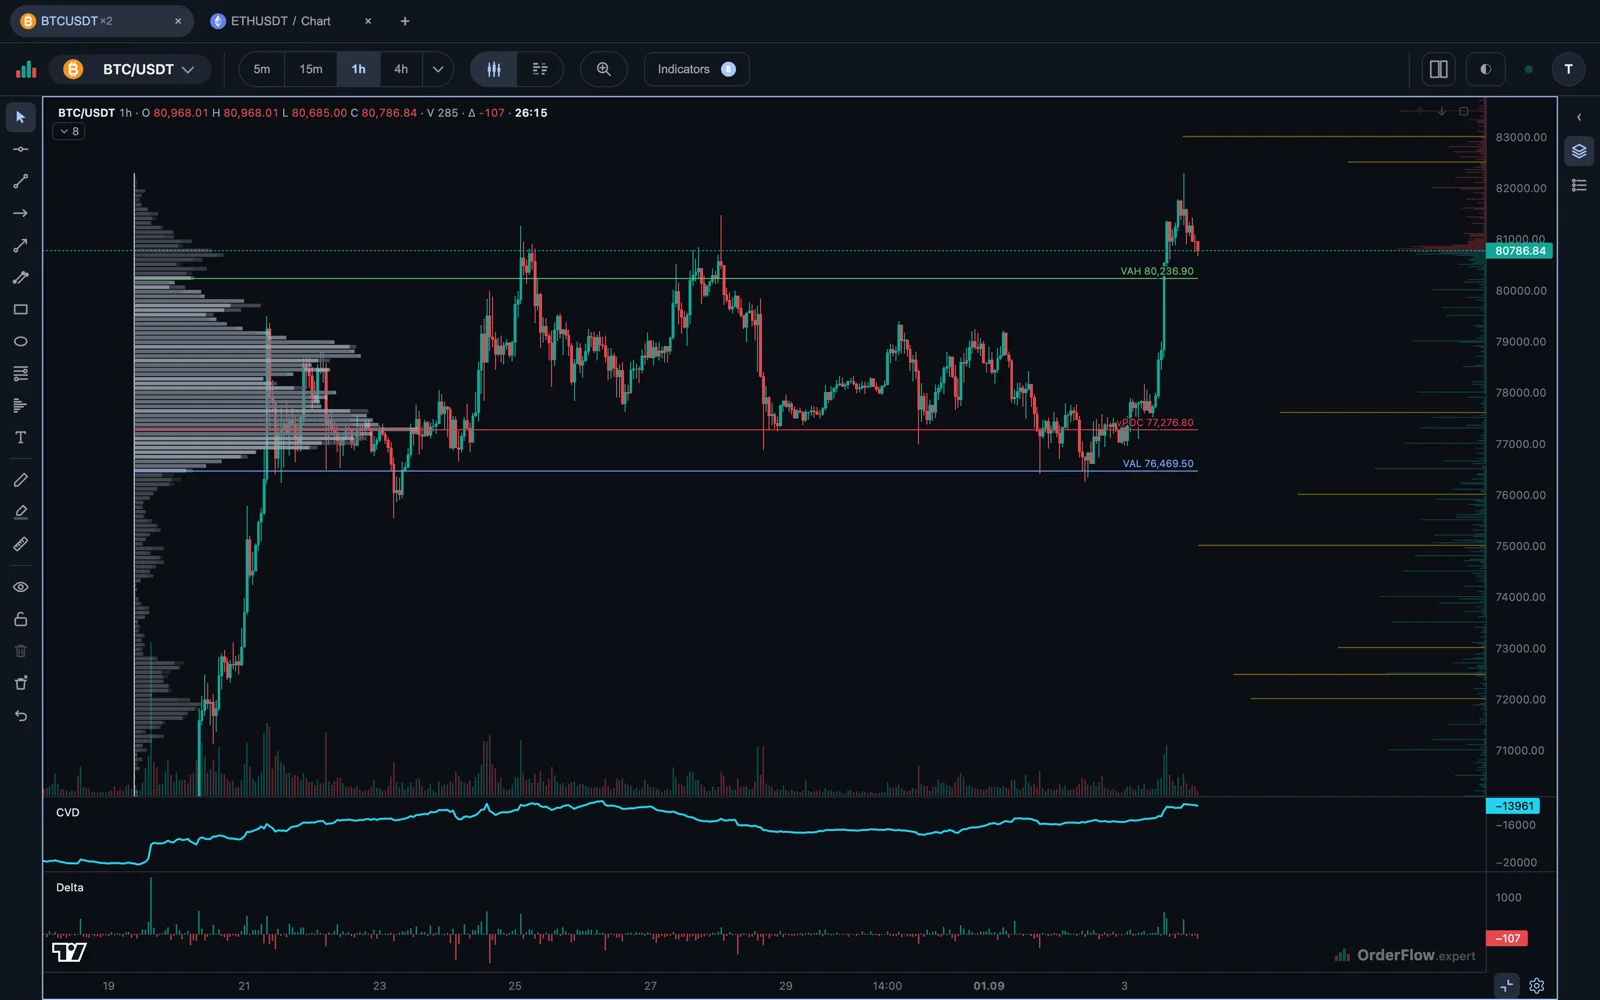
Volume Profile turns the selected range into a histogram by price. The widest row is the point of control (POC), the price with the most recorded volume in that range. The value area marks the prices that contain the configured share of volume. Together they describe where the auction spent time accepting trades, rather than where it spent the most minutes.
Every row is the volume that actually printed at that price. The profile is built from stored trade data, not by spreading a candle’s volume across the range the candle covered — which is what a chart has to do when it only keeps bars. It is the same recording the footprint reads, so a profile and the footprint under it never disagree.
Drawing a range
Draw a range over the part of the chart you want to study. A profile is tied to your chosen interval because the relevant auction may be a session, a breakout, a consolidation or a single reaction. Move or resize the range when the question changes and the profile is recalculated for the exact window you set — on the server, from stored history, so a range far longer than the bars currently loaded in your browser still measures correctly.
The shape of a profile
The outline of a profile says something of its own, so the terminal names it: a letter sits in a corner of the range.
- D — balanced. Most of the volume sits around the middle and thins out towards both edges. One area of agreement, in the middle of the range.
- P — top-heavy. The wide part is at the top, with a long thin tail below it. Price agreed in the upper part of the range and passed through the lower part quickly.
- b — bottom-heavy. The mirror of P: the wide part at the bottom, the thin tail above.
- B — double distribution. Two separate wide areas with a thin one between them. Price found one fair value, then something changed: it crossed the gap quickly and found a second one. The thin area in the middle is where the market spent almost no time.
A lower-case b and a capital B are two different shapes, not two spellings of one, so the case of the letter matters.
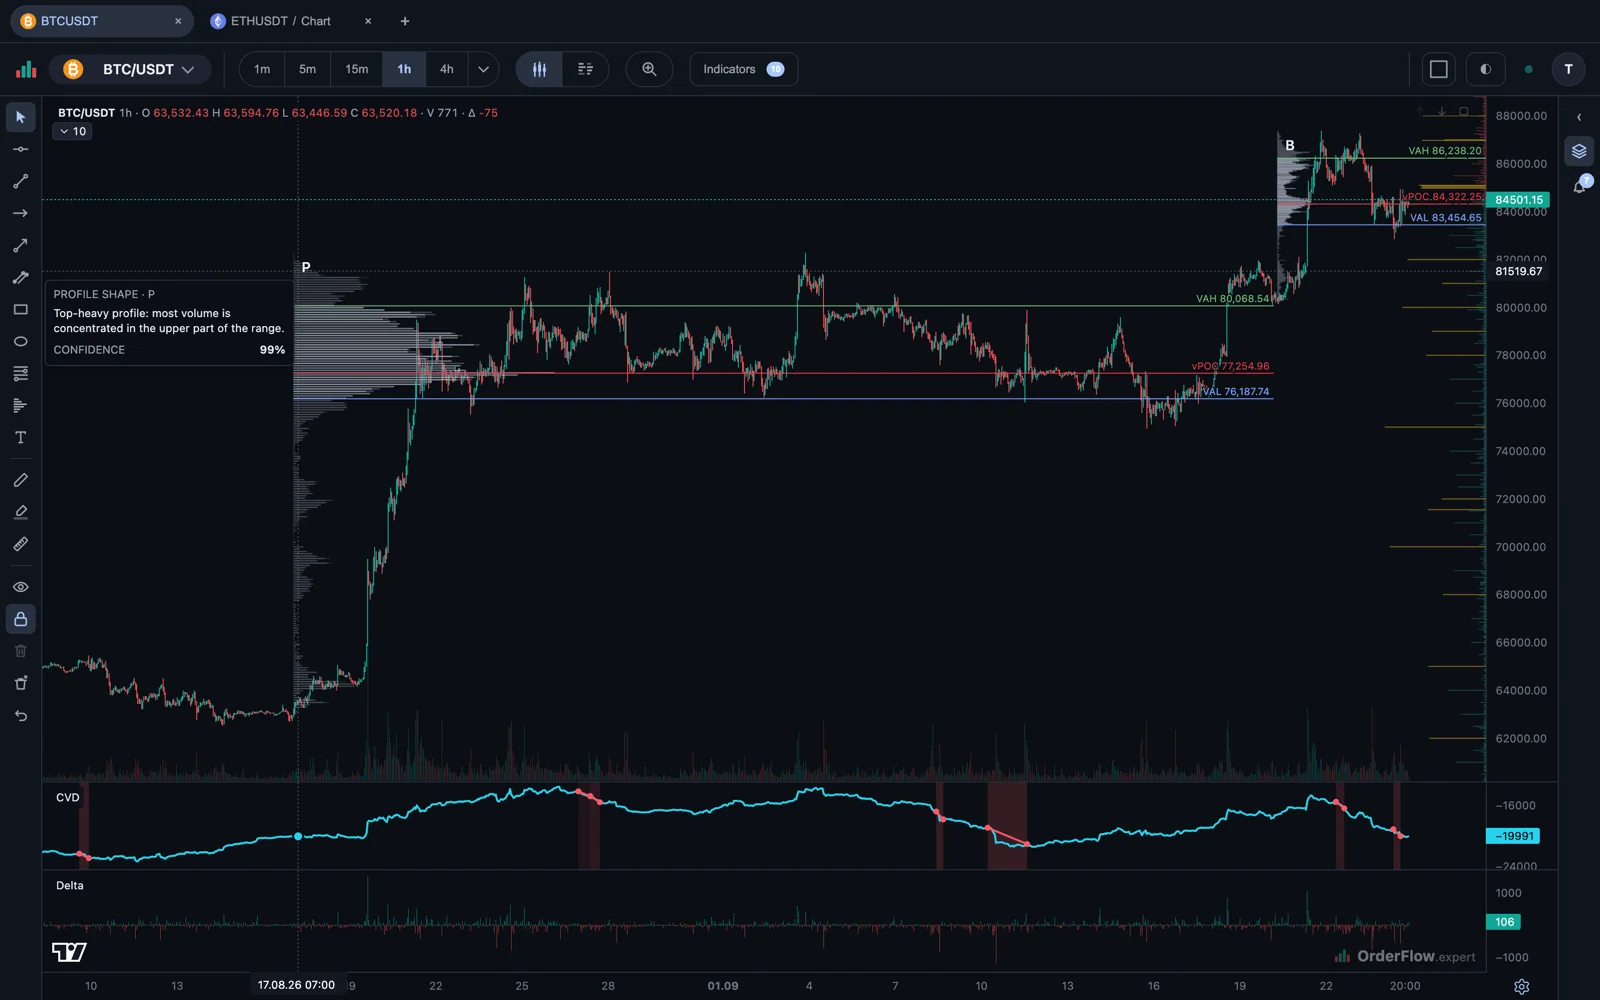
Hover the letter to see its name and how confident the classification is. When the outline is not clearly any of the four, no letter appears: a profile that is a bit of everything stays unnamed rather than being forced into a box. The shape is worked out on the server from the full detail of the recorded levels, so changing how many rows the histogram shows changes the picture, not the letter. Profile shape in the range’s settings turns the letter off, and Shape badge corner moves it.
A shape describes an auction that has already happened. You will often read that a P means short sellers were buying back and a b means holders were selling out. That may be the story, but no trade on the exchange says whether it opened a position or closed one, so the letter cannot confirm it — and none of the four says where price goes next.
Using the levels
Treat the POC as a reference point and the edges of a value area as places to watch for acceptance or rejection. A revisit can trade straight through, stall, or reverse depending on current participation. Combine the profile with the footprint and delta to see how price interacts with a level, and avoid treating any profile line as guaranteed support or resistance.