Docs / Guide
Liquidity Heatmap
A liquidity heatmap is the order book drawn over time. It paints how much size rested at each price, minute by minute — the Bookmap-style view — so you can scroll back and see where limit orders waited, built up, moved or vanished, not only what the book holds right now.
Updated
A field, not a snapshot
The live DOM shows the book right now. The Liquidity Heatmap records the limit orders in the book over time and paints it across price and time, so you can scroll back and see how a wall built up, held, moved or vanished. It is historical context for the order book, not a replacement for the live DOM.
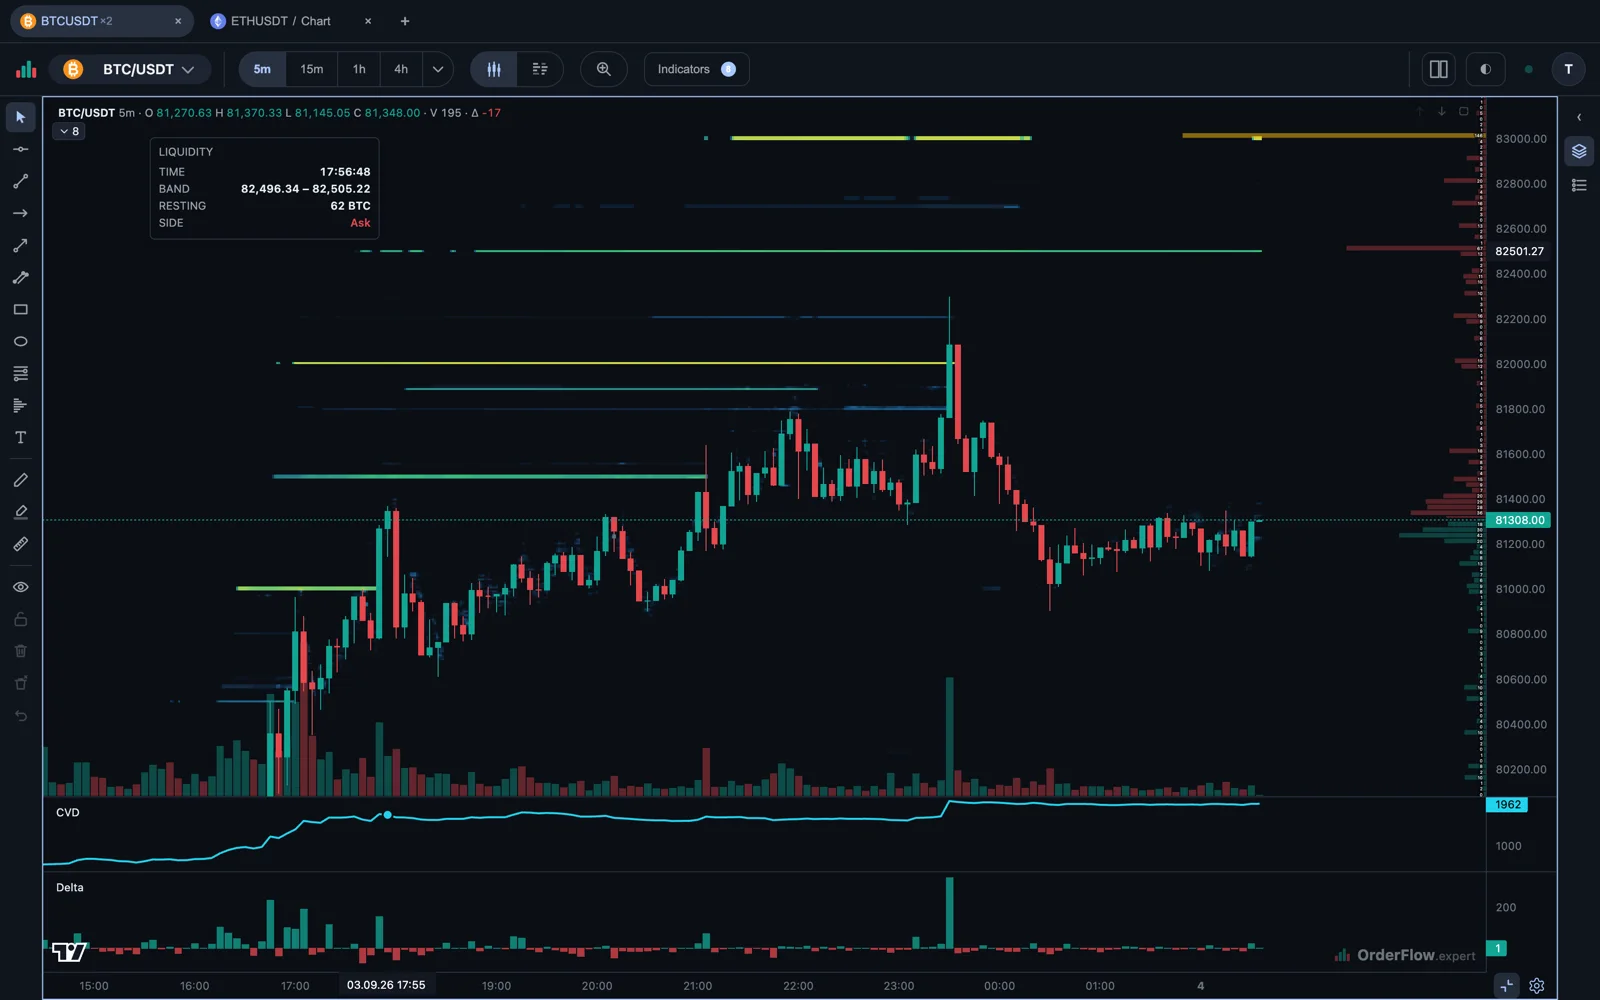
Reading the colour
Colour intensity represents the relative amount of displayed limit-order size at a price and moment. It does not say whether the level is bullish or bearish. Hover a cell to inspect the recorded side and value, then compare that level with the price path and the trades that occurred there.
Walls, spoofs and shadows
A wall that persists through several recordings carries different information from one that flashes and disappears. Neither proves intent: displayed orders can be cancelled, and a large quote can be moved before price reaches it — placing one with no intention of trading it is called spoofing, and on a crypto exchange you should expect to meet it. Use the heatmap to ask how liquidity behaved, then wait for price and executed flow to show whether that behaviour mattered.
Pairing it with whale trades
The most useful moments often combine views. Watch a whale-trade bubble arrive at a heatmap wall: did market orders consume the level, did it refill, or did price reject before reaching it? The footprint and delta tell you what executed; the heatmap supplies the history of what was waiting.
Common questions
Is the heatmap the same as the order book? No. The live DOM shows the book at this moment and nothing else. The heatmap keeps a record of it — an averaged picture of the book every minute, kept for a year — so a level can be judged by how it behaved before price arrived.
Does a bright band mean price will turn there? No. Brightness only says how much size was displayed. Orders can be pulled before price arrives, and a level that held once can be traded straight through the next time. Treat a band as a question — what happens when price gets there — and let the executed trades answer it.
Why do bands appear and vanish? Traders add, move and cancel limit orders all the time. A band that stays for many minutes and refills after it is traded into is a different thing from one that shows for a moment and leaves; the second can be spoofing.