Docs / Guide
Worked example: BTC at 82,000
Real data from 21 September 2026: a wall of sell limit orders at 82,000 on BTC/USDT, a buying spike that stalled against it, selling that got nowhere from below, and the breakout that held. Walked through bar by bar with the footprint, delta and the Liquidity Heatmap.
Updated
This page follows one price through one night on a real chart, using the tools from the rest of the guide. The market is BTC/USDT on five-minute bars, the date is 21 September 2026, and all times are UTC. The price is the round number 82,000.
We chose this day because the example is clear. Plenty of days are messier, and each pattern below also turns up on days when it fails. That is why every step ends with the price action that would have proved it wrong.
The level and the wall
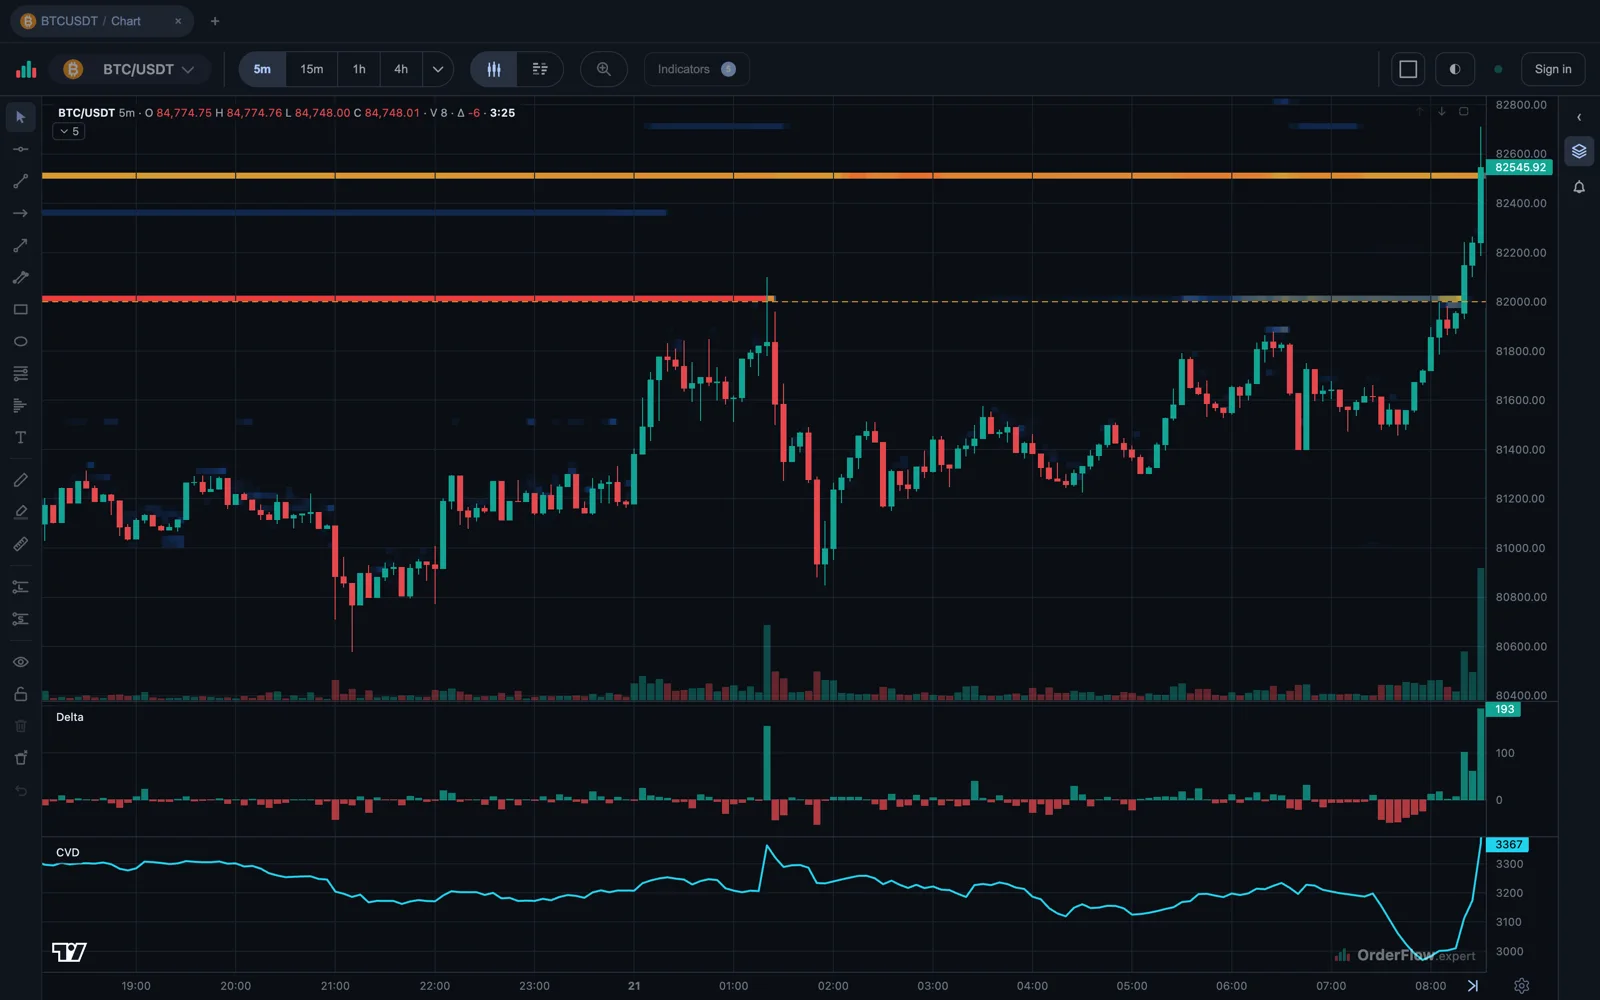
Round numbers draw attention, and many traders were watching 82,000 that night. The Liquidity Heatmap shows why this one mattered: since the morning of 20 September, limit orders (makers) to sell had been sitting exactly at 82,000, about 110 to 120 BTC, several times more than at any nearby price. That is a wall. Anyone buying through 82,000 had to fill all of it first.
In these screenshots the heatmap’s lower cut-off is raised to 22 BTC. That hides the ordinary liquidity around the candles and leaves only the walls.
01:20: buyers hit the wall and stall
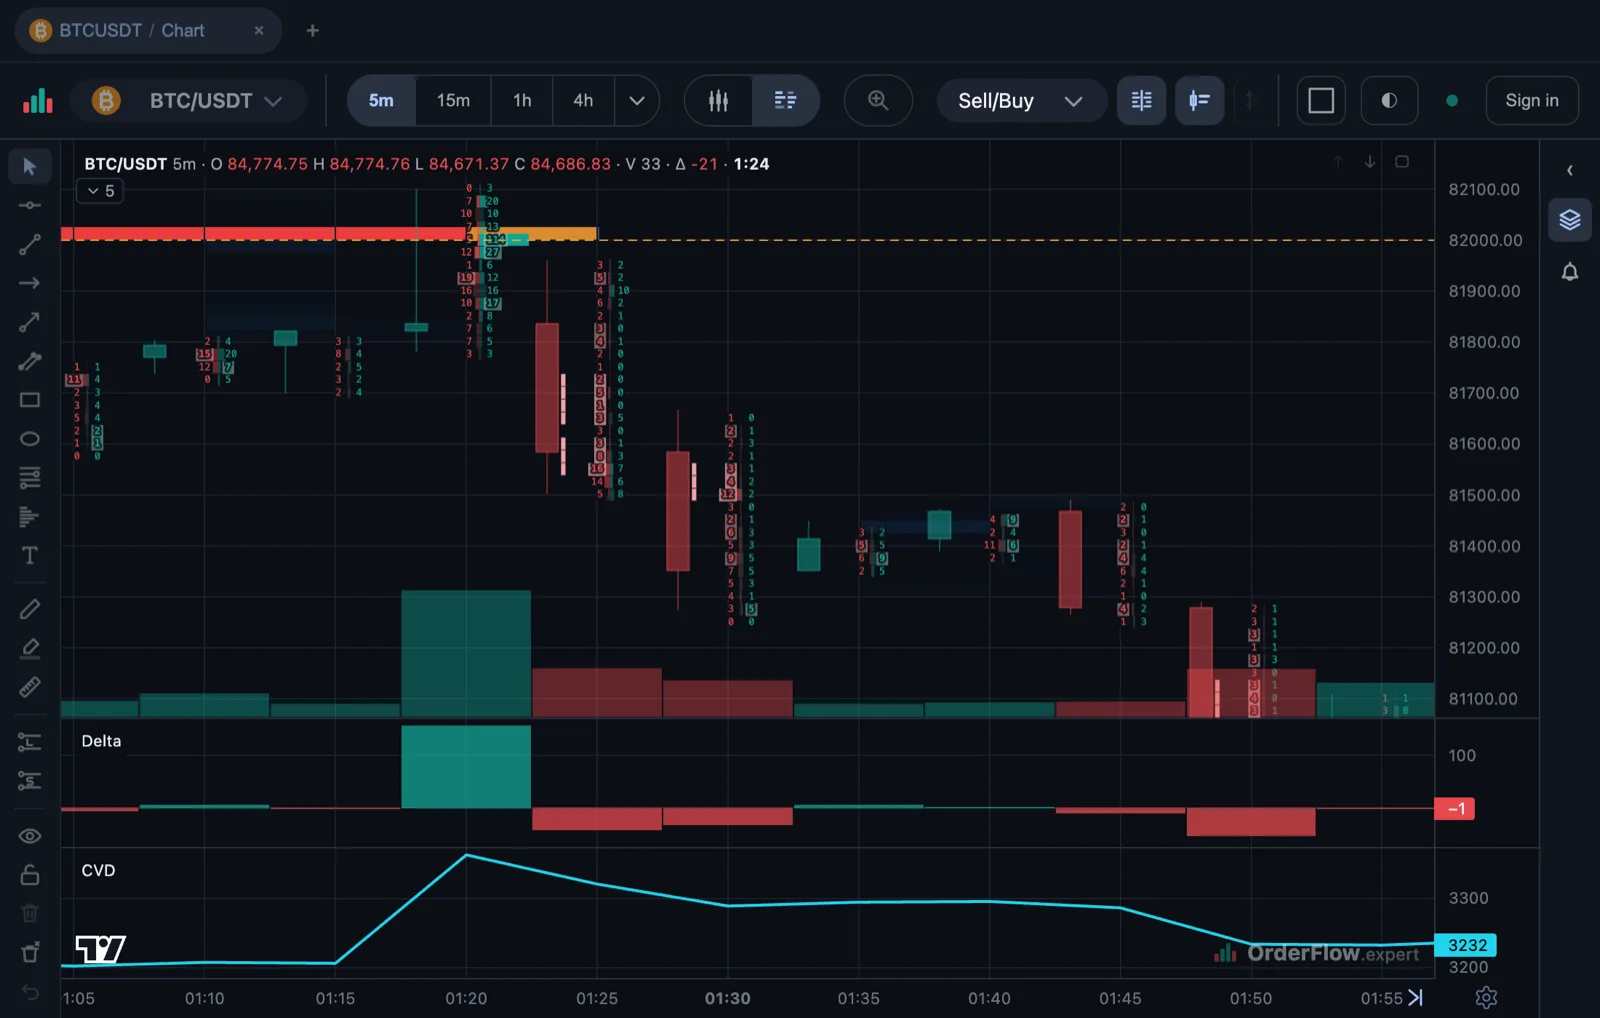
At 01:20 buyers arrived all at once. The bar traded 367 BTC, about ten times as much as the bars before it: 262 BTC of market buying against 105 of market selling, a delta of +157. On the footprint the 82,000 row shows 5 sold against 114 bought, almost exactly the size of the wall.
The buying ate the wall, and on the heatmap it disappears in that bar. Price hardly moved, though. The bar spiked to 82,100 and closed at 81,836, a few dollars above its open. Heavy volume with no progress is what absorption looks like, and here the wall did the absorbing. Once it was filled, no one was willing to pay more.
From there the sellers took over: delta −42 at 01:25 and −32 at 01:30, and by 01:55 price was at 80,850, 1.2 % lower. Of the four common setups, this was a failed breakout: heavy market buying at a level everyone was watching, and nothing to show for it. The idea would have been wrong if price had held above 82,000 with market buying still coming in over the next bars. It did not.
07:30: sellers cannot push it lower
A few hours later the same thing happened in reverse. From 07:30 to 07:55 six bars in a row had more market selling than buying: delta −42, −47, −47, −38, −31 and −23. Yet price would not go below 81,458, and from 07:40 every bar closed higher than the one before. Limit orders to buy were soaking up everything the sellers sent. This time the absorption was on the buyers’ side.
Meanwhile the wall at 82,000 had come back, but smaller: around 25 BTC in the early hours and 40 to 55 BTC through the morning, less than half of what had stopped the first attempt. On the overview it is the fainter band that returns to the level.
08:20: the breakout that held
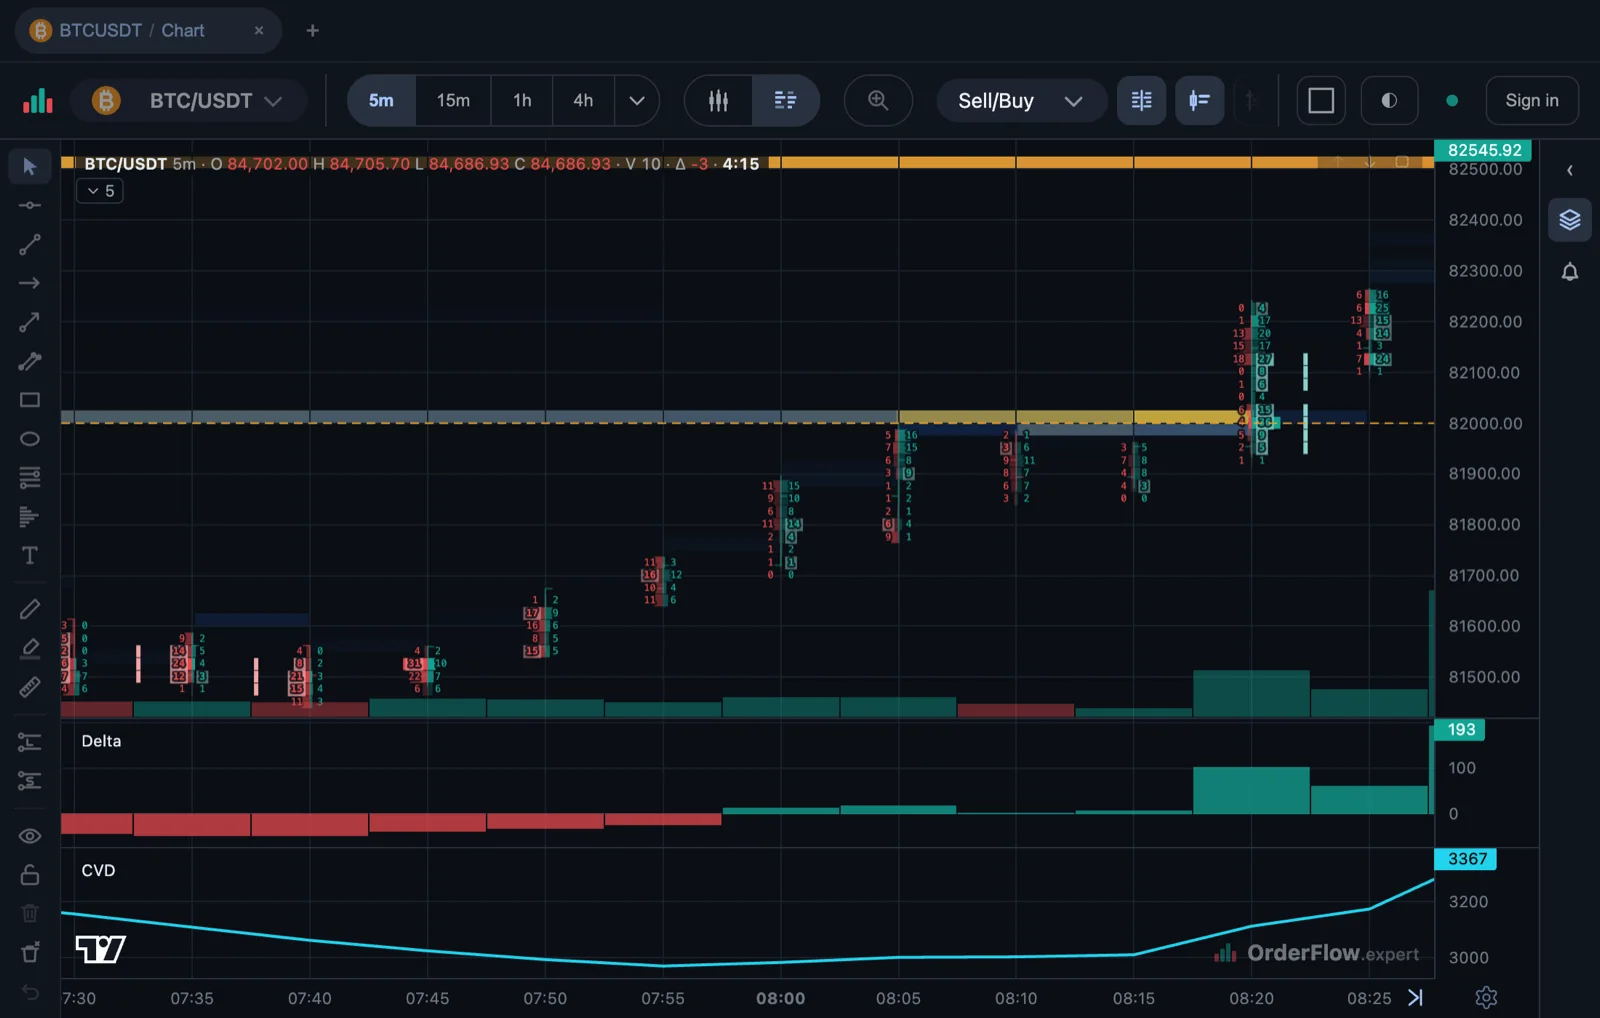
At 08:20 buyers came back to 82,000. The bar traded 237 BTC, about five times the usual: 170 BTC of market buying against 67 of selling, delta +102. This time buyers were ahead on all thirteen rows of the bar, 82,000 included (4 sold against 36 bought), and by the next bar the thinner wall was gone.
What set this apart from 01:20 was the follow-through. Market buying kept coming: delta +61 at 08:25, +194 at 08:30 and +532 at 08:35, when price reached 84,174. An hour after the break BTC was 2.3 % higher, four hours after it 3.8 % higher, and it never closed back below 82,000. This is a breakout with real buying behind it, market orders paying higher prices bar after bar. The idea would have been wrong if the buying had dried up straight away and price had slipped back under 82,000.
What was different the second time
Same level, same day, and both attempts began with a burst of heavy buying, yet they ended in opposite ways. Three things separated them, and all three were on the screen at the time:
- The size of the wall. At 01:20 buyers ran into a wall as large as everything they bought at that price. At 08:20 the wall was less than half that size.
- What came before. For half an hour before 08:20, sellers had failed to push price down, which showed that buyers with limit orders were waiting underneath.
- The follow-through. After 01:20 the next bars belonged to the sellers. After 08:20 market buying kept coming.
At neither moment could you have known how it would end. What you had was a place to act and a clear sign of being wrong: price back above 82,000 after 01:20, or back below it after 08:20.
This is how a trader might have seen that night, not a recommendation to buy or sell; what you do with it is your own decision.