Docs / Guide
Delta and the aggressor
Delta is market buy volume minus market sell volume, taken from the exchange’s own flag on every trade. How to read it, when it diverges from price, and where it misleads.
Updated
Where delta comes from
Delta is market buy volume minus market sell volume. Every trade has one market order in it (the taker): a buy order that crosses the spread to take the ask, or a sell order that crosses it to take the bid. The other side is a limit order (the maker) that was waiting. The terminal sorts trades by the side of the market order and sums the difference for each bar or footprint level.
That flag comes from the exchange, trade by trade. It is not inferred from the shape or the colour of a candle, which is how a chart has to guess when it only keeps bars — and why the same bar can produce a different delta in two different tools.
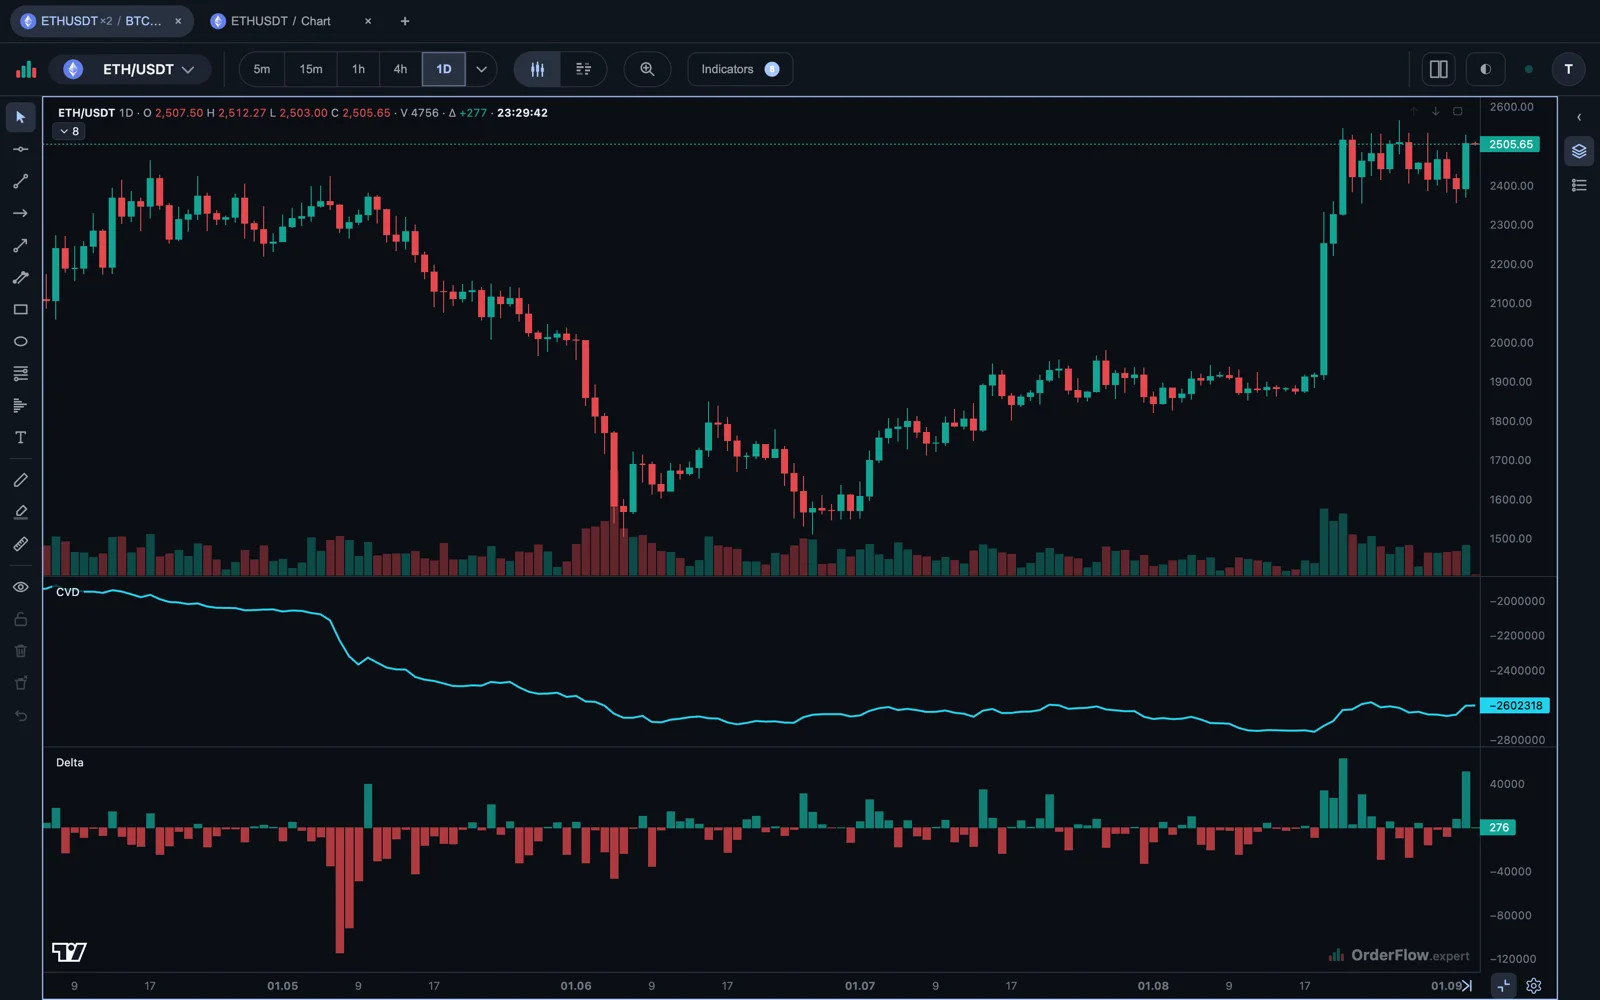
Reading bar delta
Positive delta means more market buy orders lifted the ask than market sell orders hit the bid; negative delta means the opposite. Read its size relative to the bar’s total volume and its place in the current range. A modest positive delta after a quiet pullback can matter more than a large value during a high-volume news move. Compare delta with where price actually closed, not just with its sign.
Divergence
Price can rise while delta is negative, or fall while delta is positive. That is not an error. It can mean limit orders absorbed the market orders, or it can simply reflect activity elsewhere in the bar. A divergence becomes useful when it appears at a meaningful level and price confirms it. Traders use it that way to spot a move that nobody is paying for any more, as in the exhaustion setup.
Where delta misleads
Delta sees completed market orders; it cannot see every limit order, cancellation or hidden source of liquidity. Strong positive delta into a ceiling may be buyers exhausting themselves against a seller, not a breakout. Pair it with the footprint, the live order book and the Liquidity Heatmap, and keep risk decisions independent from any single indicator.