OrderFlow.expert

You have a question about the chart.

Order flow can answer it — if someone translates. A footprint records every trade at every price; we tell you what that means, in words you already use.
  • Free to use
  • Nothing to install
  • Any device

The workspace

And this is what it is reading.

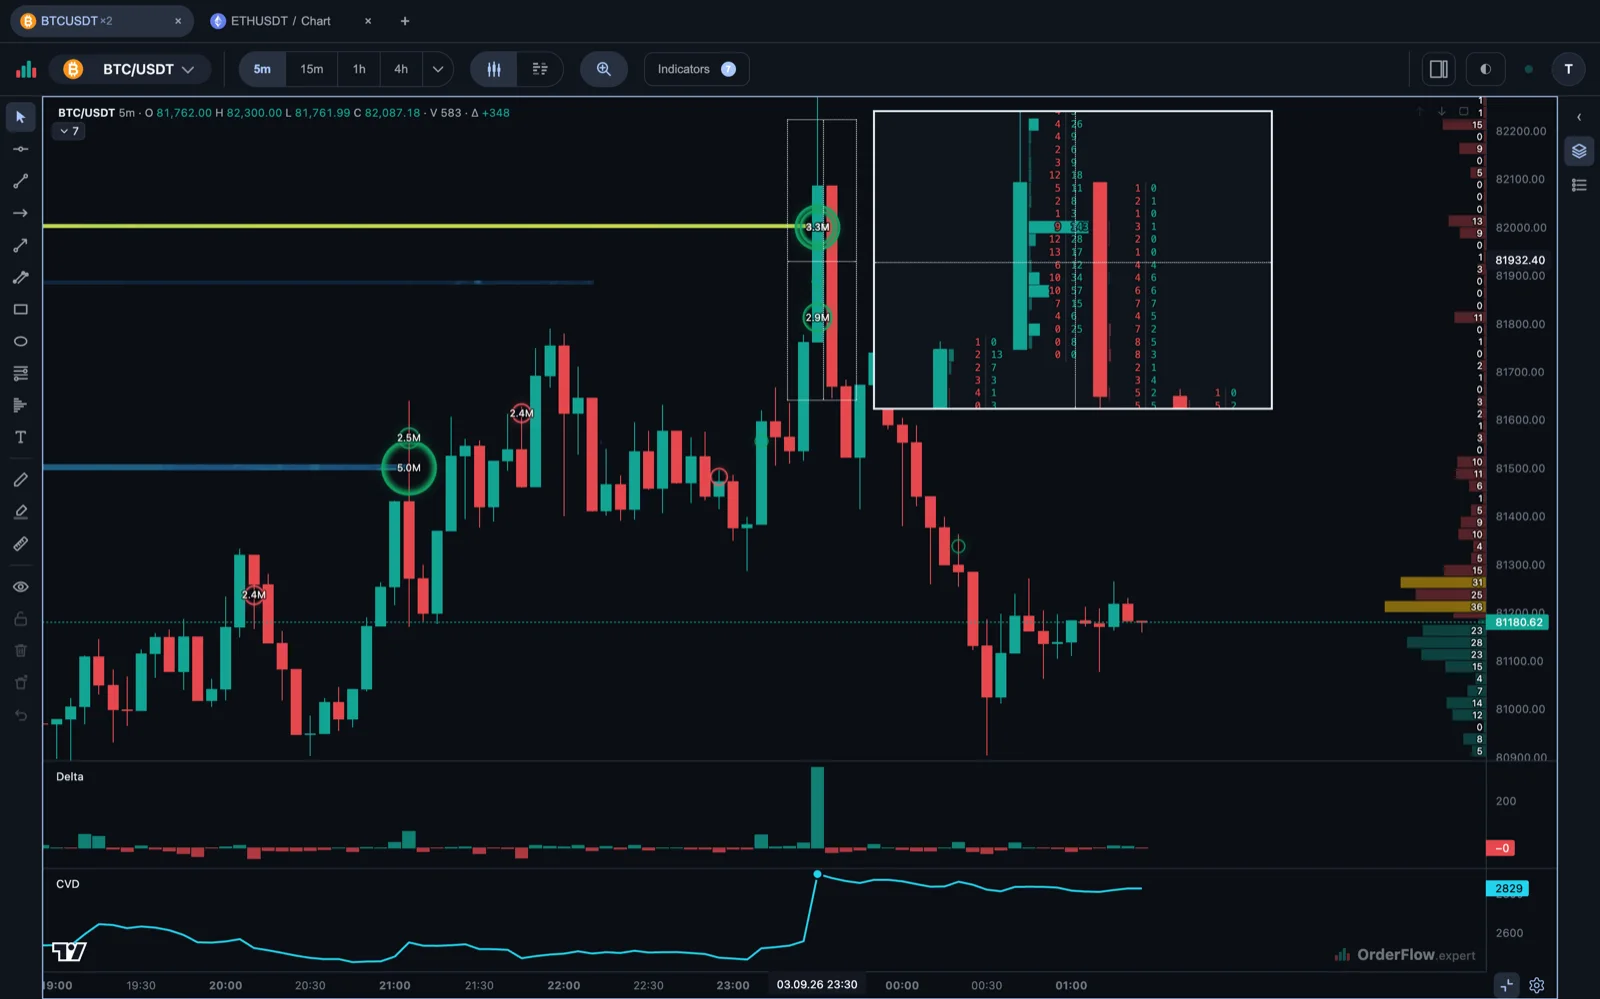
Every large aggression marked, a magnifier that opens the auction inside five bars, liquidity resting at a price, delta and cumulative delta — one screen, no tab switching.
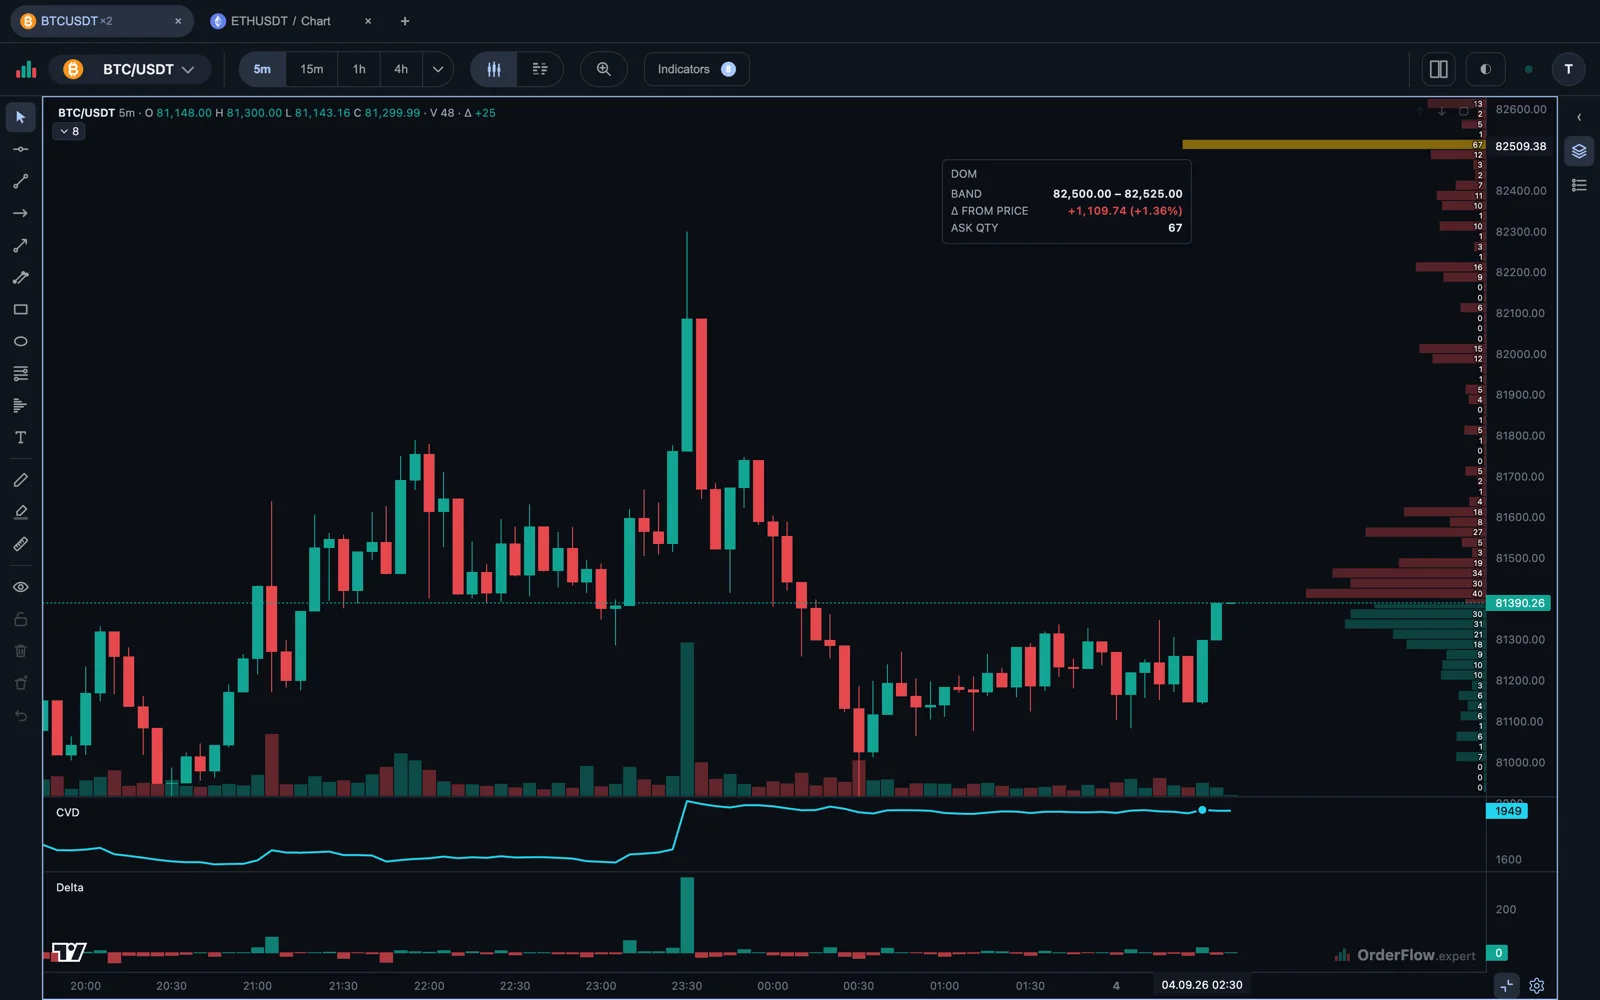
BTC/USDT · complete order-flow workspace live data
The terminal on BTC/USDT, five-minute candles. Green rings mark the largest single aggressions, the biggest of them five million dollars. A magnifier panel opens the footprint of five bars — how much sold and how much bought at every price. Horizontal bands are liquidity resting in the book, the order book itself runs along the right edge, and delta and cumulative delta sit in panes below.

Layouts

Four questions at once, in one tab.

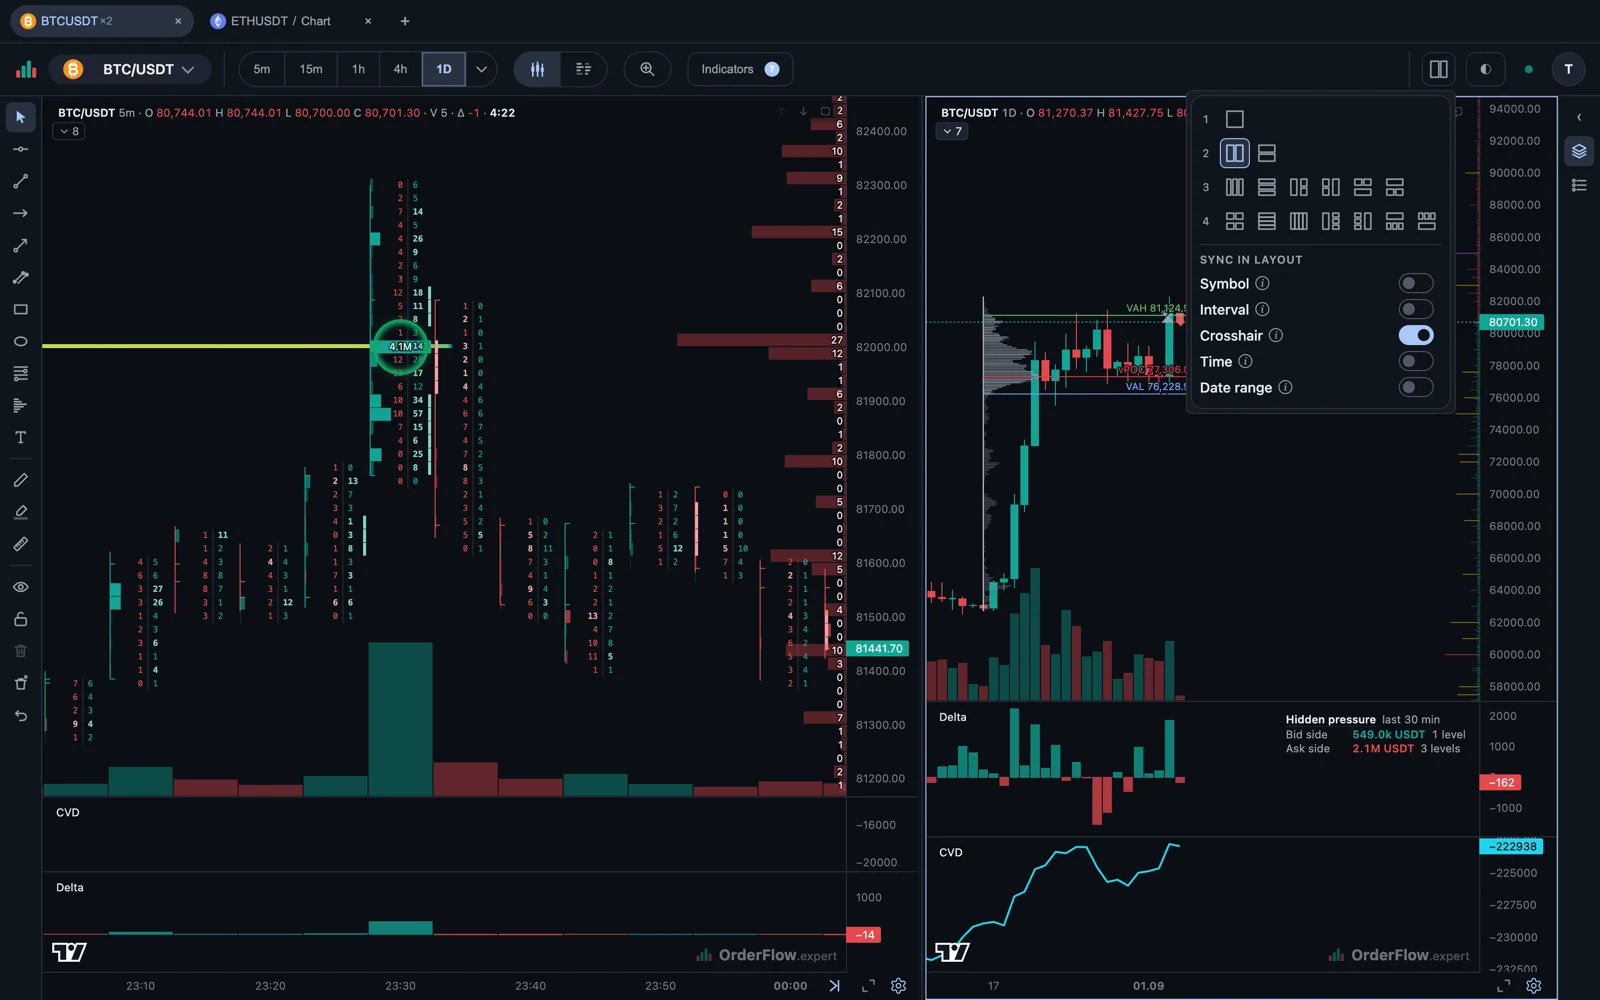
A tab holds up to four charts, side by side or stacked. Each keeps its own instrument, timeframe, indicators and drawings — and switches decide what they share.
  • Split the tab in two, three or four
  • Sync the symbol, the interval, the crosshair or the date range
  • Saved with the tab, restored the way you left it
one tab · multi-chart layout live data
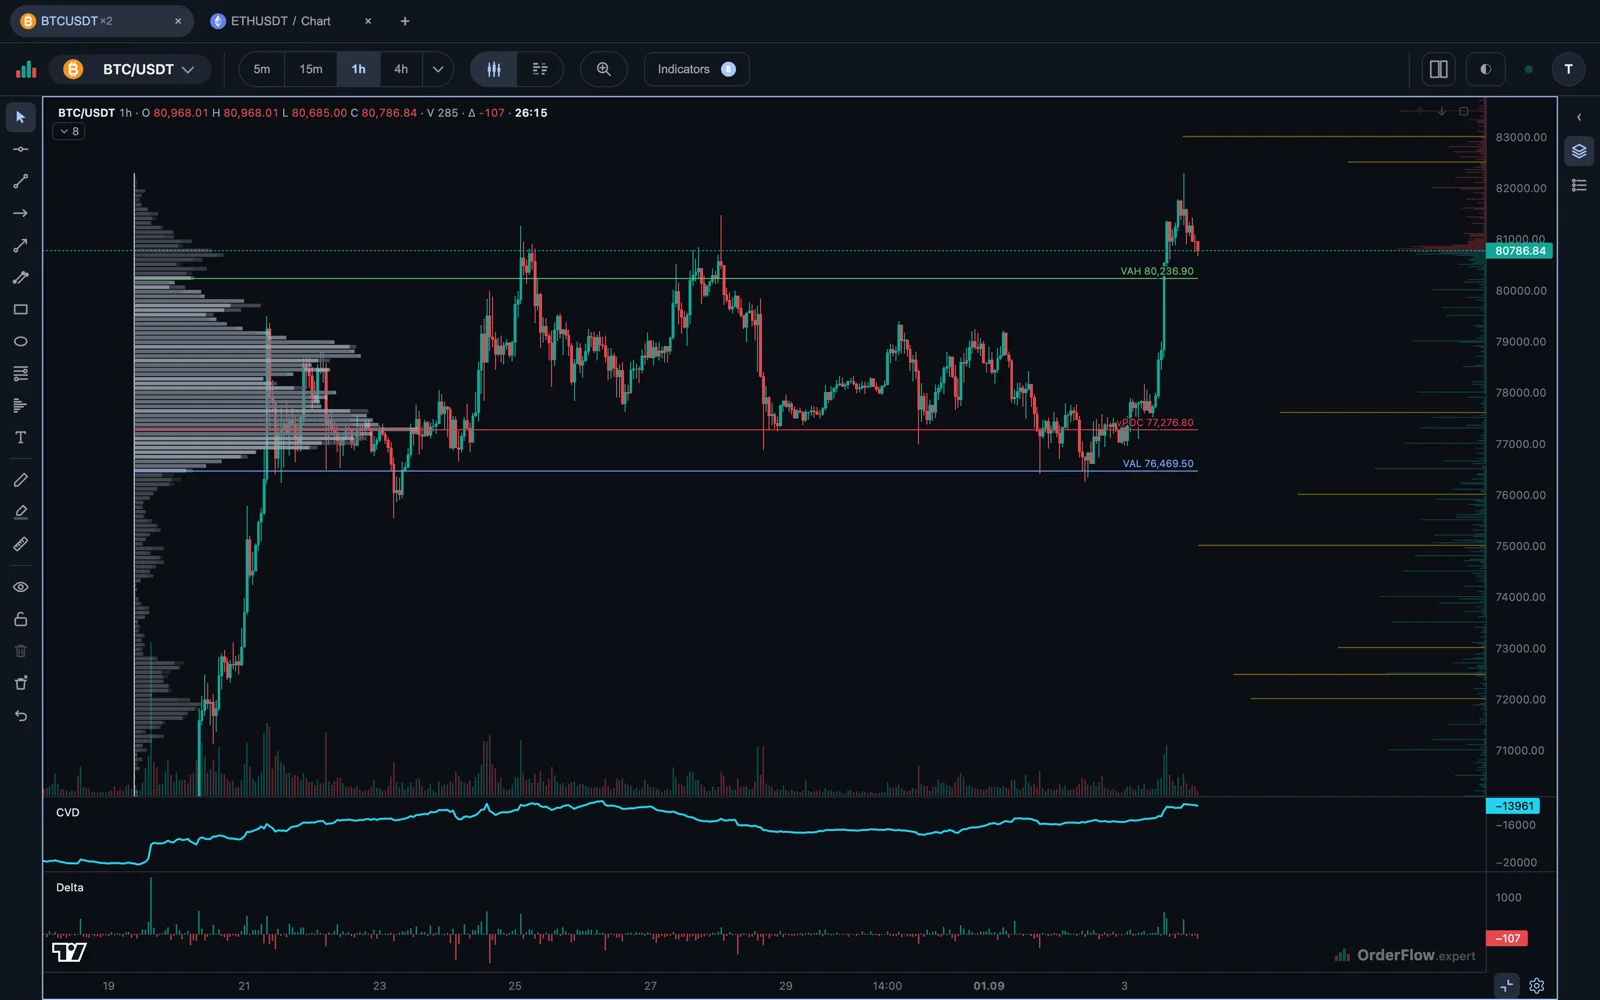
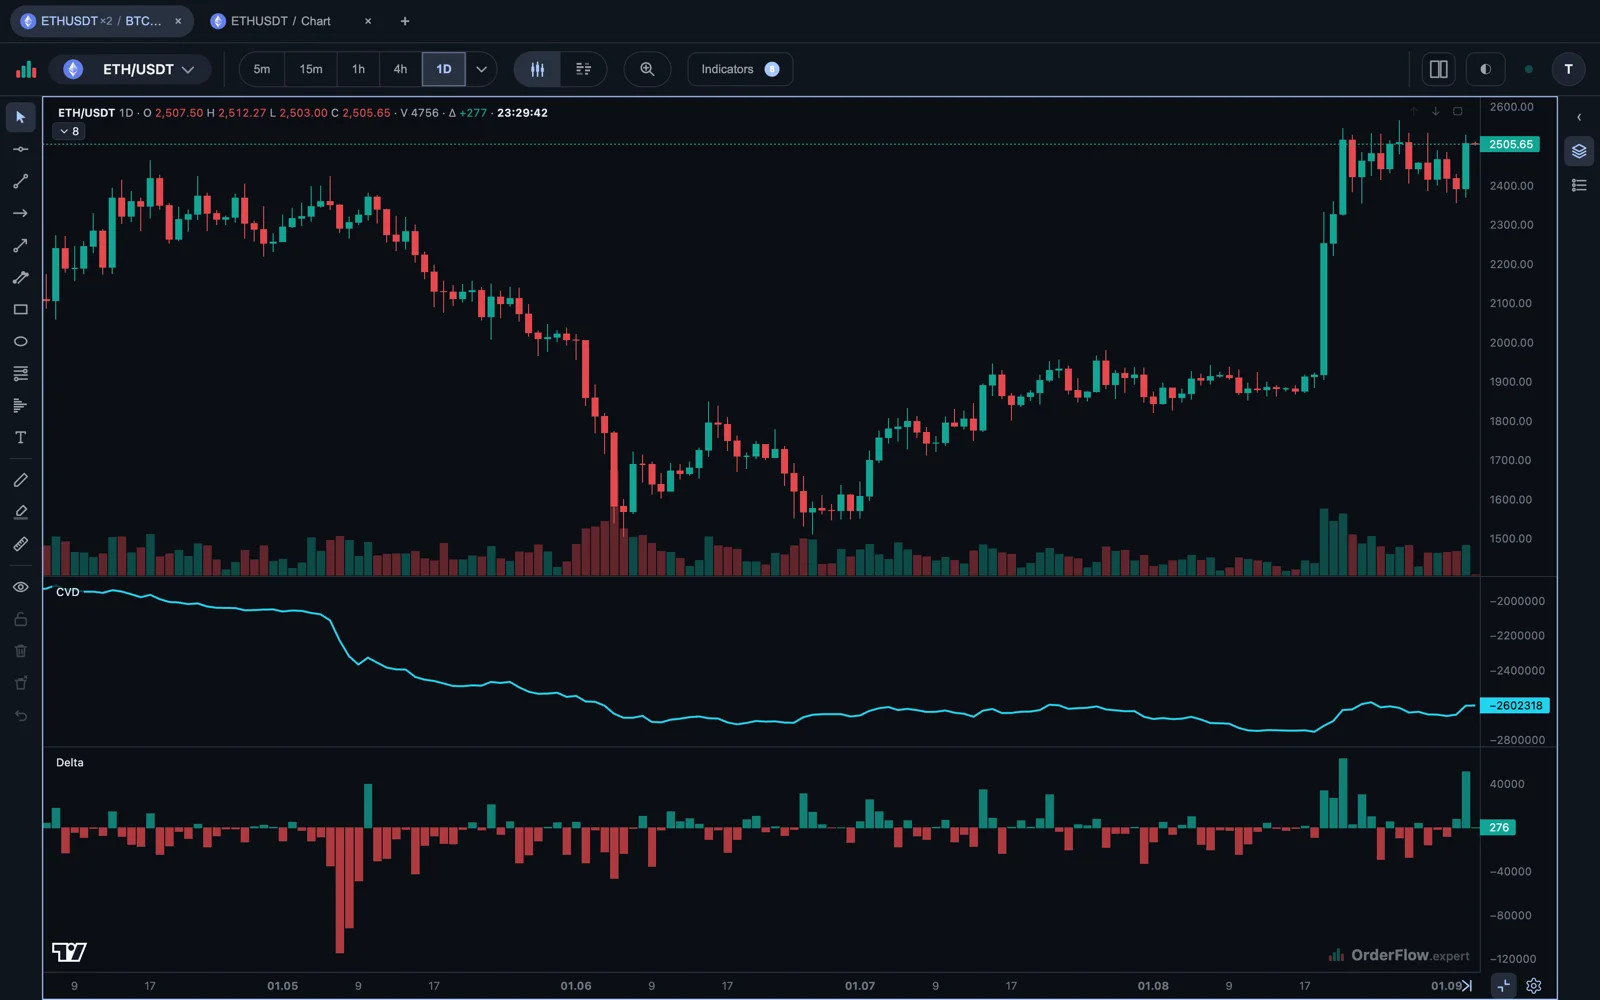
One tab split into two charts: on the left a five-minute footprint of BTC/USDT with the order book beside it, on the right the same instrument by day with a Volume Profile over it. Each chart carries its own delta and cumulative delta panes. The arrangement picker is open, showing every split from one chart to four, and under it the switches that decide what the charts share — symbol, interval, crosshair, time and date range.

Start here

Three things, and the chart opens up.

Nobody is born reading a footprint. These are the three ideas everything else is built on.

Read the beginner’s guide
  1. Who was in a hurry

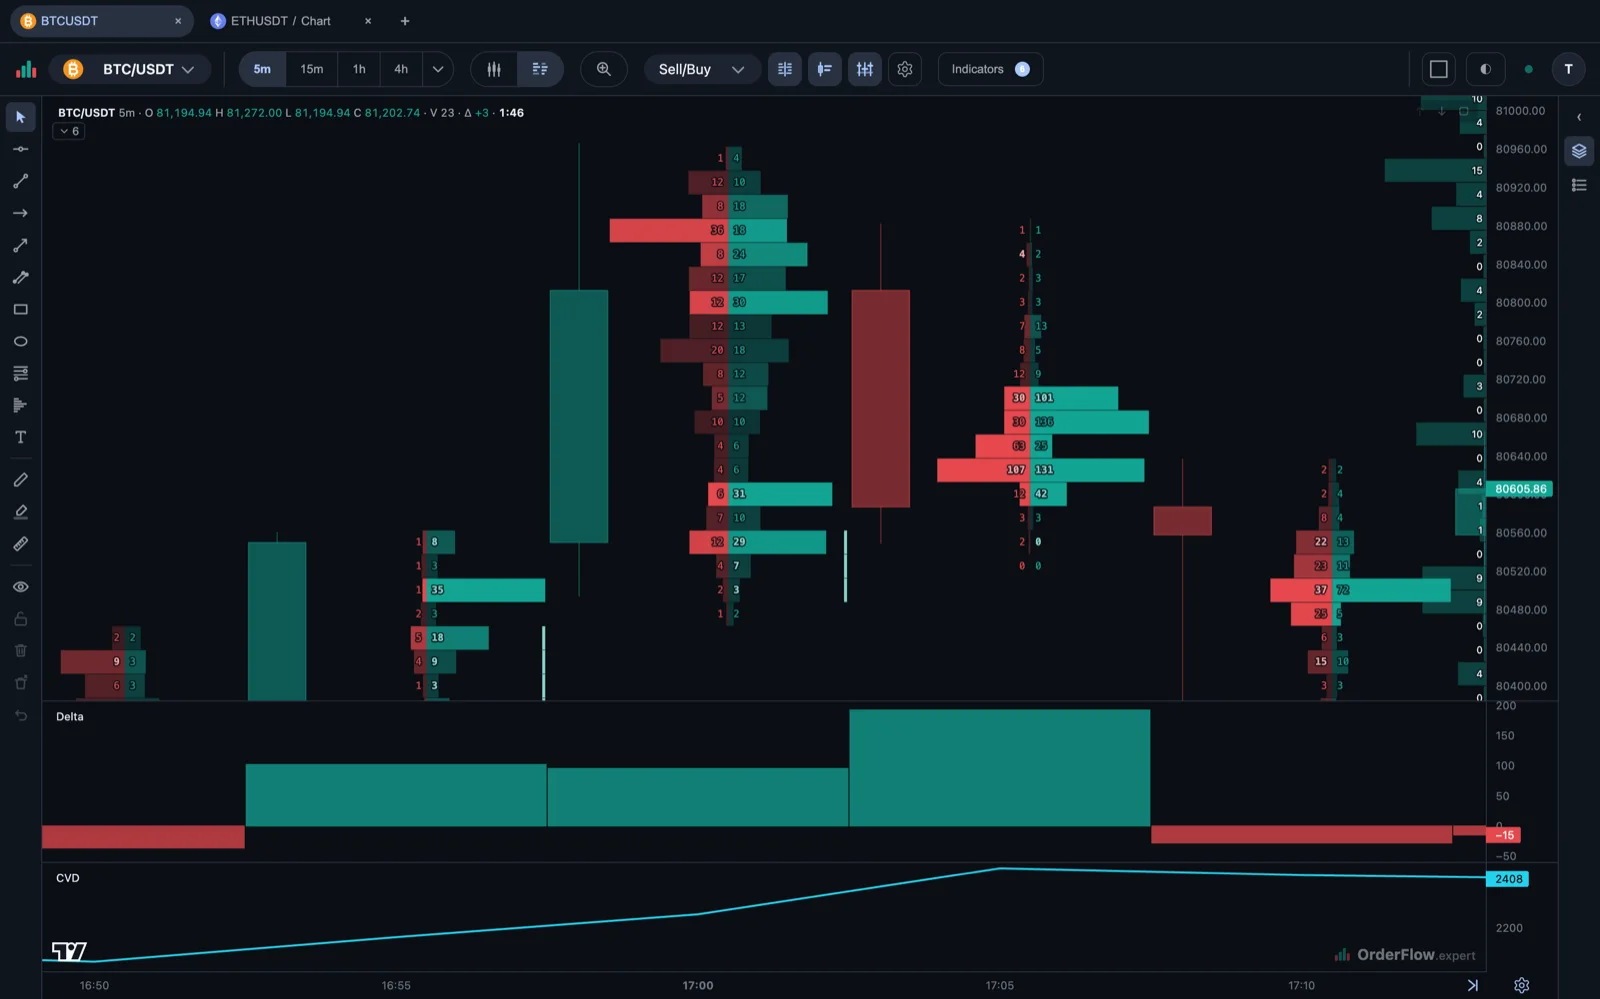
    Two numbers at every price: how much sold into the bid, how much bought into the ask.

  2. Where someone leaned hard

    Bold numbers mark an imbalance — one side traded at least three times the other at that price.

  3. Whether it mattered

    Heavy selling that fails to move price is the single most useful thing a footprint shows you.

Accuracy

Most charts guess your delta. We measure it.

An answer is only as good as the number under it — so ours does not come from a guess.

The usual approach

The whole volume of an up candle counts as buying. Change the timeframe and the answer changes with it — sometimes even its sign.

How we do it

Every trade on the exchange names the side that sent the market order. We read that flag, trade by trade.

Delta = market buys − market sells
CVD = running total of Delta

Liquidity

Watch the wall build, hold, then vanish.

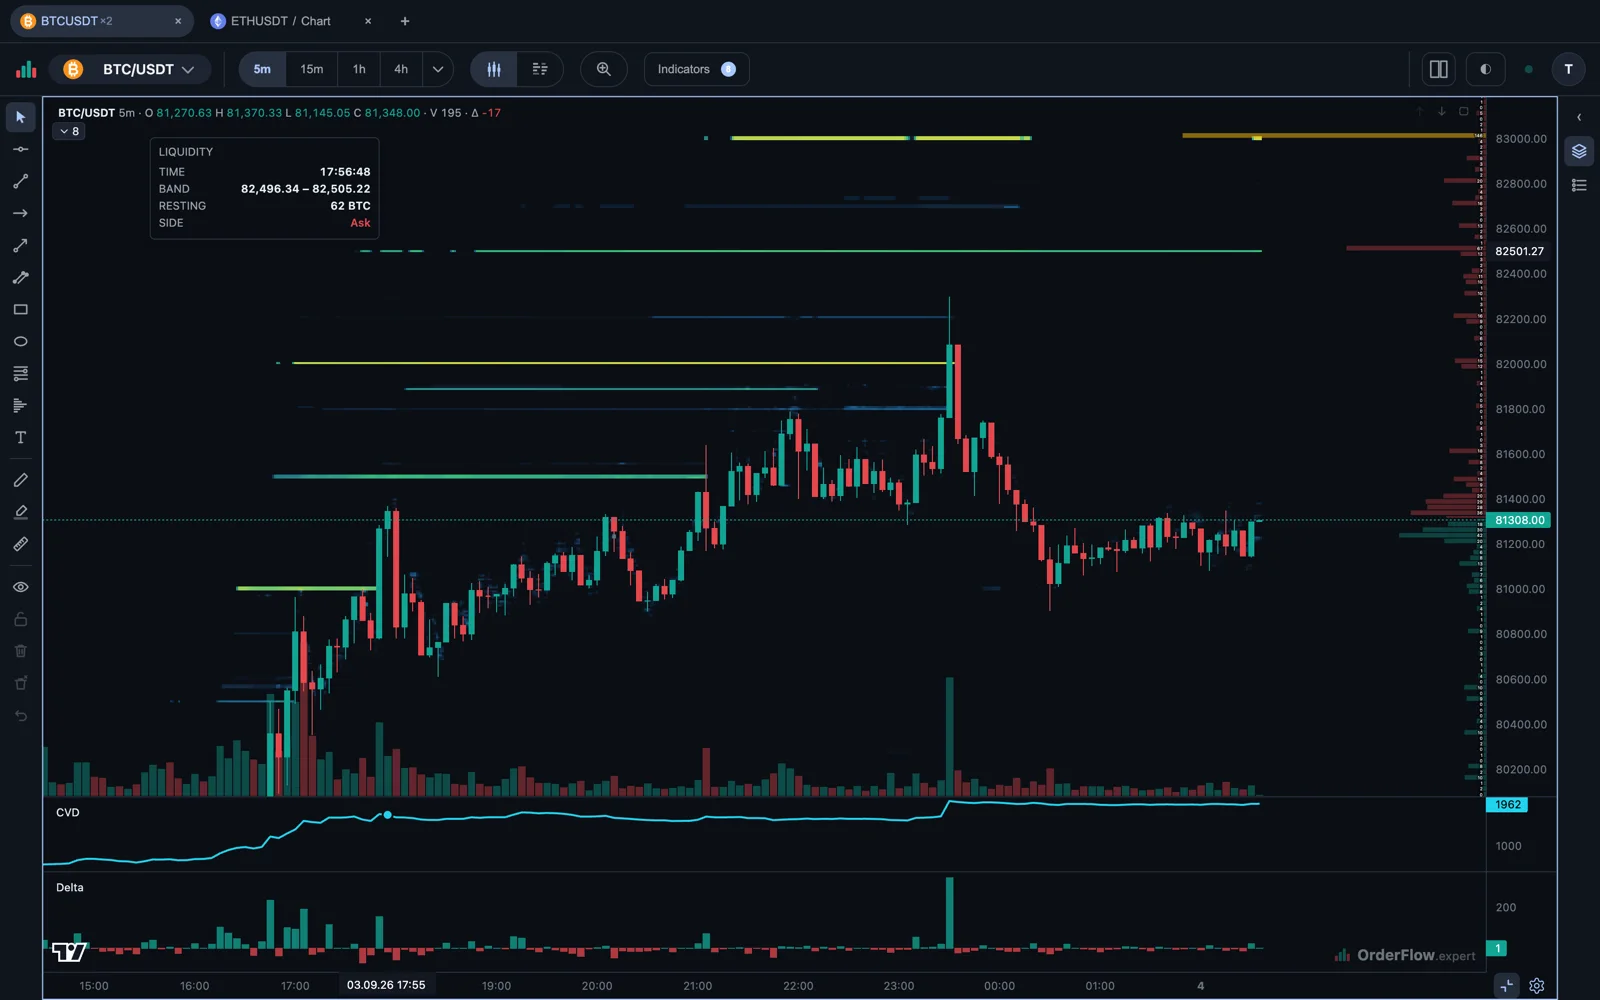
The live book shows what is resting right now. The heatmap records it over time, so you can scroll back and see how liquidity behaved before price got there.
  • Live order-book strip beside the price
  • Bookmap-style price × time heatmap
  • Volume Profile over any range you draw
liquidity heatmap · price × time recording
BTC/USDT candles with recorded liquidity drawn as horizontal bands across time: the brighter and longer a band, the more size rested at that price and the longer it stayed. A panel reads one of them: the band 82,496 to 82,505, 62 BTC resting on the ask.

No install

Open a tab. That’s the whole setup.

Professional order-flow terminals want a download, a licence and a machine to run them on. This one is a web page — and the heavy lifting does not happen on your laptop.

Nothing to install

No desktop client, no licence key, no update to sit through. The chart is live in the time it takes a page to load.

Whatever you have on you

Laptop, desktop, tablet. Tabs, layouts and drawings live on the server, so you pick up where you left off on the next device.

Our servers do the counting

Aggregating millions of trades into clusters and profiles happens on our side. Deep history and deep zoom don’t depend on your machine.
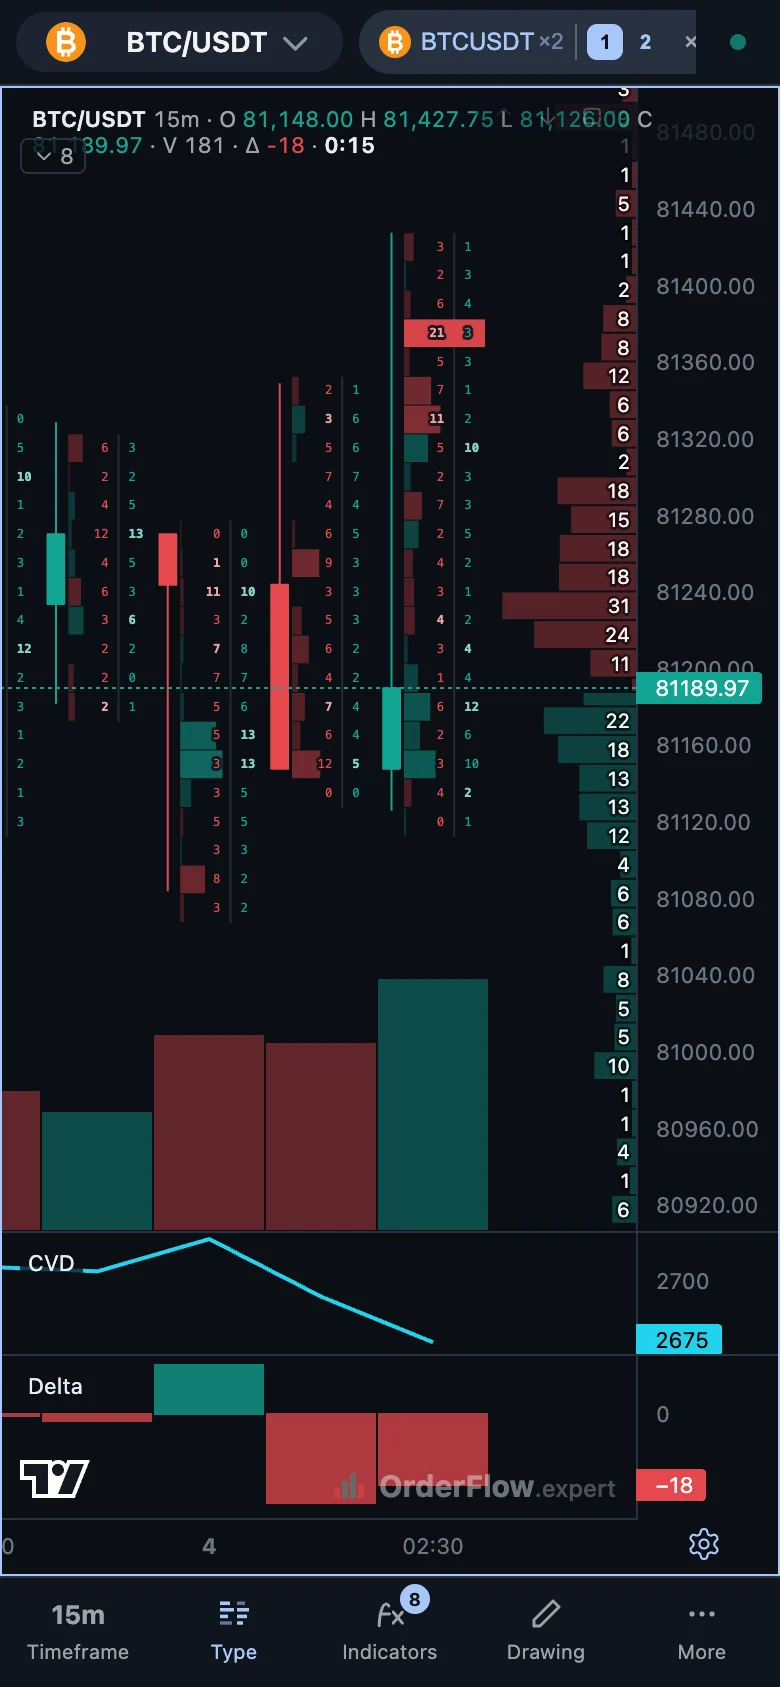
The same terminal on a phone: footprint candles with the order book beside them, cumulative delta and delta below, and a bar along the bottom for timeframe, chart type, indicators and drawing.
Same chart, same data — on a phone.

Coming next · not in the product yet

Then the answer comes to you.

Everything above is the product today: the chart, the annotations and the guides. Next, an assistant that reads the same order flow you are looking at and answers the question you actually asked.

It cites what it read — the footprint level, the delta, the wall in the book — instead of handing you a verdict.

Is this a good entry?

That is not a call I make. What I can tell you is what the flow is doing: buyers absorbed 88 into 64,256, the book still shows a bid wall under it, and CVD has not confirmed the move.

  • Footprint 64,256
  • CVD flat
  • Book: bid wall

Under the hood

Real instruments, not simplified toys.

Plain answers are only worth something if what sits beneath them is the real thing. If you already read tape, this is yours from the first click.

See the auction inside every bar

The footprint itself, at every zoom level.

  • Footprint candles with per-price bid/ask volume
  • Cluster modes: Sell/Buy, Delta and Volume
  • Imbalances highlighted where one side of a price dominates the other
  • Five-bar magnifier for the prints under the cursor
  • Per-cell tooltip: volume, quote volume, trades, buy/sell, delta and the price band

See pressure before price confirms it

Who is sending market orders, and where the limit orders are waiting.

  • Delta and cumulative delta (CVD) with smoothing and grouping periods
  • Whale trades — one participant’s whole order, reconstructed as a single event, not a scatter of exchange prints
  • Live order book heatmap (DOM) — the limit orders waiting at each price
  • Liquidity Heatmap — limit orders across price and time, Bookmap-style
  • Volume Profile over any range you draw
  • CVD candles whose wicks follow the real intrabar path, not a guess

Keep the studies you already trust

The indicators you already use, so nothing forces a second tab.

  • Volume with its own moving average
  • Moving Average and Bollinger Bands
  • Anchored VWAP with optional bands
  • MACD, RSI, MFI, ADX, Stochastic
  • Market Sessions in market-local time

Set it up once, find it tomorrow

A layout you set up once and find again tomorrow.

  • Saved tabs, each with its own layout, panes and indicators
  • Up to four charts in one tab, with switches for what they share
  • Drawing tools: trend lines, channels, Fibonacci, measure, pen, highlighter, oval
  • Named settings templates for indicators and shapes
  • Watchlists and a per-tab side dock
  • Light and dark themes

Get told with the tab closed

Our servers watch the condition, not your browser.

  • Price-level alerts placed straight from the chart and dragged to a new level
  • Whale-trade alerts above a size you choose
  • Checked on our servers, so they fire while your browser is closed
  • Telegram push, plus a toast and a log inside the terminal
  • Once or every time — with a cooldown, quiet hours and an expiry date
  • Its own notification sound, chosen per alert

Go back as far as the question needs

BTC/USDT history back to 2017 on our own servers, so a profile across months is measured rather than approximated from what your browser loaded.

Still being built

More markets and instruments, and the assistant above. Today the terminal covers spot markets and perpetual futures contracts on major crypto pairs.

Bring a question. Leave with an answer.

No signup. No install. Nothing to lose by looking.

Open the terminal

Analysis tool for informational and educational use. Not investment advice.