Docs / Guide
Cumulative delta (CVD)
Cumulative volume delta (CVD) is the running total of bar delta. Grouping periods, smoothing, the candle view, and how to read it against price.
Updated
What it accumulates
Cumulative delta — CVD, sometimes written cumulative volume delta — is the running sum of bar delta. It turns a sequence of market buying and selling into a path you can compare with price. The starting point matters: changing it changes the absolute level, while the slope and turning points describe the behaviour within the selected period.
Grouping periods
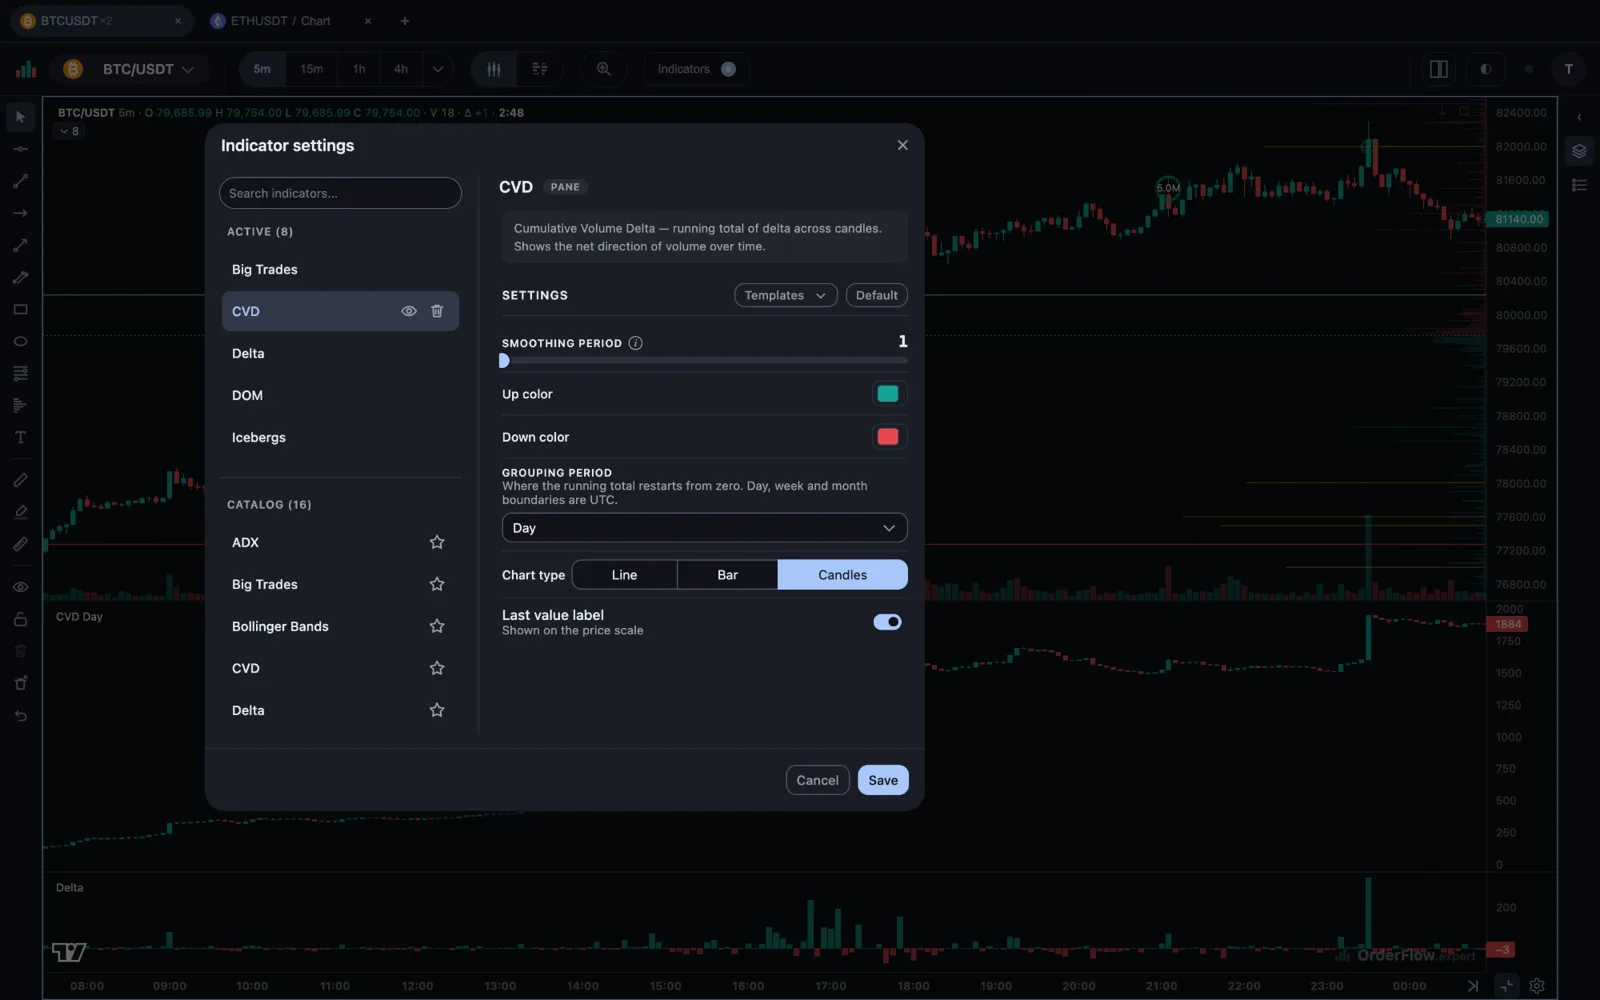
Choose All to keep one continuous running total for loaded history. Choose Day, Week or Month to reset CVD at that boundary. Visible bars resets the reading to the part of the chart you are studying. A reset is a lens, not a new source of data: use the grouping period that matches the question you are asking.
Smoothing
Smoothing applies a moving average to the CVD line. It can make the prevailing pressure easier to see, but it also delays turns and hides short bursts of market orders. Start with smoothing off, then add only enough to reduce noise for your timeframe.
Candles instead of a line
The CVD candle view shows the open, high, low and close of cumulative delta inside each bar. Its wicks use the available lower-timeframe delta path rather than an invented straight line, so they show the intrabar extremes CVD actually reached. The line view is better for continuity; candles make each interval’s range easier to inspect.
Using it with price
When price and CVD make higher highs together, market buying is broadly behind the move. When they disagree, pause and inspect the footprint and liquidity before drawing a conclusion. A divergence near a grouping reset may be only an artefact of the chosen lens, so compare it with a second grouping period and with the raw delta bars.
Common questions
What is the difference between delta and CVD? Delta is market buying minus market selling inside one bar. CVD adds those bar deltas up, so it shows whether buying or selling has dominated over a stretch of bars, not just in one.
Why does CVD differ between charting tools? Some tools do not know which side each trade came from and estimate it, often by counting a whole lower-timeframe candle as buying when it closed up and as selling when it closed down. Here every trade carries the exchange’s own mark of which side sent the market order, so delta and CVD are counted rather than estimated. The grouping period changes the level too: two charts that reset at different times show different numbers for the same trades.
Does a CVD divergence mean a reversal? No. A divergence means that price and net market orders disagree for a while. Check that it holds on a second grouping period, and look at the footprint at the extreme, before you read anything into it.