Docs / Guide
The live order book (DOM)
The live order book (DOM, market depth) beside the price: what the limit orders waiting there are, how the bands are grouped, and how to tell a wall from a shadow.
Updated
The book, right now
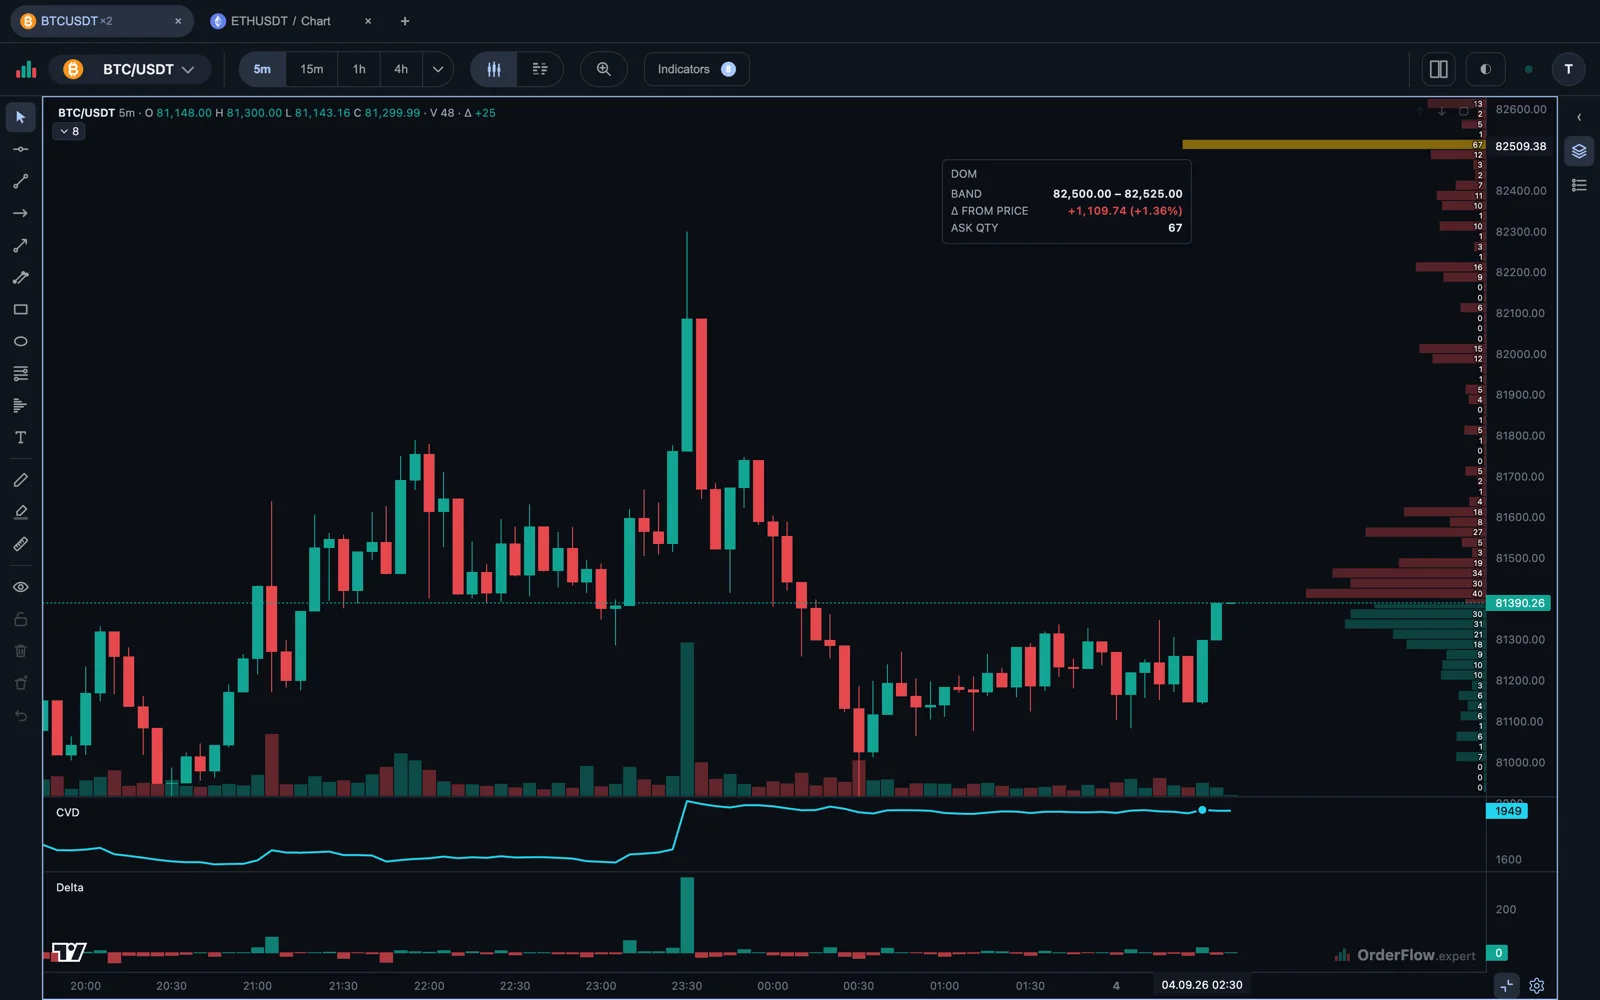
The DOM overlay is a live view of the limit orders (makers) waiting as bids and asks around the current price. Its bands show how much quoted liquidity is available at each grouped price range, with stronger colour indicating relatively larger displayed size. It is a snapshot of the book now. To study how those levels appeared and moved over time, use the Liquidity Heatmap.
Banding
Exchanges publish many tightly spaced price levels. The overlay groups nearby levels into bands so the chart remains readable at each zoom level. A smaller band size shows more price detail; a larger one reveals broader areas of supply and demand. Choose a scale that fits the symbol’s price step and the timeframe you are watching.
What the book does not promise
Displayed size is intent, not commitment. A participant can add, cancel or move an order before it trades. A bright band is therefore a level to observe, not proof of support or resistance. Watch whether it remains in place as price approaches, gets traded into, or disappears.
Reading it with the footprint
The footprint shows the market orders that hit a level; the DOM shows the limit orders available around it. When repeated market selling hits a bid area and price holds while the band persists or refreshes, you may be seeing absorption. When the band vanishes before contact, the same level may have offered no real resistance. The combination gives more context than either view alone. The footprint guide covers the market-order side of that pair.
Common questions
Is the DOM the same as the order book? Yes. DOM — depth of market — and order book name the same thing: every limit order waiting to buy (the bids) and to sell (the asks) at each price. The terminal draws it beside the price scale, so the book lines up with the chart.
Why does a wall disappear just before price reaches it? Because its owner cancelled or moved it. A displayed order costs nothing until it trades, and a large order shown with no intention of trading is called spoofing. A wall that stays while it is being traded into says more than one that leaves.
What does the DOM not show? Anything that is not displayed. An iceberg order shows a small part of itself at a time, so the book can hold more than it displays.